Article

Analysis of Sea Storm Events in the Mediterranean Sea: The Case Study of 28 December 2020 Sea Storm in the Gulf of Naples, Italy

1
Dipartimento di Scienze della Terra, Università degli Studi di Napoli Federico II, dell’Ambiente e delle Risorse (DiSTAR), Via Cinthia 21, 80126 Naples, Italy
2
Istituto Nazionale di Geofisica e Vulcanologia (INGV), Sezione di Napoli-Osservatorio Vesuviano, Via Diocleziano 328, 80124 Naples, Italy
3
Consiglio Nazionale delle Ricerche (CNR), Istituto Nazionale di Ottica (INO), Sede di Napoli, Comprensorio Olivetti Via Campi Flegrei, 34, 80078 Naples, Italy
4
Consiglio Nazionale delle Ricerche (CNR), Istituto di Scienze Marine (ISMAR), Sede di Napoli, Calata Porta di Massa-Porto di Napoli 80, 80133 Naples, Italy
5
Consiglio Nazionale delle Ricerche (CNR), Istituto di Ricerca su Innovazione e Servizi per lo Sviluppo (IRISS), Via Guglielmo Sanfelice, 8, 80134 Naples, Italy
*
Author to whom correspondence should be addressed.
Appl. Sci. 2021, 11(23), 11460; https://doi.org/10.3390/app112311460
Submission received: 22 July 2021 / Revised: 21 November 2021 / Accepted: 24 November 2021 / Published: 3 December 2021
(This article belongs to the Special Issue Remote Sensing and GIS in Environmental Monitoring)

Abstract

:
The coastline of the Gulf of Naples, Italy, is characterized by a series of infrastructures of strategic importance, including touristic and commercial ports between Pozzuoli to Sorrento, main roads, railways, and urban areas. Furthermore, the Gulf of Naples hosts an intense traffic of touristic and commercial maritime routes. The risk associated with extreme marine events is hence very significant over this marine and coastal area. On 28 December 2020, the Gulf of Naples was hit by an extreme sea storm, with severe consequences. This study focuses on the waterfront area of Via Partenope, where the waves overrun the roadway, causing massive damage on coastal seawall, road edges, and touristic structures (primarily restaurants). Based on the analysis of the meteorological evolution of the sea storm and its effects on the waterfront, we suggest that reflective processes induced on the sea waves by the tuff cliffs at the base of Castel dell’Ovo had an impact in enhancing the local-scale waves magnitude. This caused in turn severe flooding of the roadway and produced widespread damage along the coast. The analysis of the event of 28 December 2020, also suggests the need of an effective mitigation policy in the management of coastal issues induced by extreme sea storm events. Wind-based analysis and prediction of the sea wave conditions are currently discussed in the literature; however, critical information on wave height is often missing or not sufficient for reliable forecasting. In order to improve our ability to forecast the effects of sea storm events on the coastline, it is necessary to analyze all the components of the coastal wave system, including wave diffraction and reflection phenomena and the tidal change. Our results suggest in fact that only an integrated approach to the analysis of all the physical and anthropic components of coastal system may provide a correct base of information for the stakeholders to address coastal zone planning and protection.

1. Introduction

Coastal areas are periodically subject to significant economic and environmental damages due to sea storm-induced processes [1]. Extreme marine storms may result in severe indirect (e.g., land subsidence, water supply contamination, salt intrusion) and direct (e.g., coastal erosion, flooding, vegetation destruction, damage to property and infrastructures) impacts on low-elevation coastal areas [2].
Mediterranean coasts are characterized by a very high population density that induces high social vulnerabilities when coastal infrastructures are directly exposed to wave action [3]. The occurrence of numerous coastal cities, river deltas, islands, low-elevation coastal areas and cliffs over the Mediterranean coastal zone recalls the need for considering local features in coastal planning and possible future impacts associated with climatic change. Today, storms in the Mediterranean Sea are frequent, especially during the winter [4], and their impact on coastal areas can be highly hazardous. A potential increase in hazards due to Mediterranean cyclones, or hurricanes induced by global warming is suggested by several studies [5], which document and predict longer, stronger, and more hazardous tropical-like cyclones associated with stronger winds and rainfall, despite a general decrease in frequency of intense meteoric events. Storm surges may display significant differences in various regions of the Mediterranean, due to the morphology of different areas and the characteristics of individual storms [6]. Several episodes of significant wave height (above 3 m) are often recorded each year in specific sectors of the Mediterranean, such as Lion Gulf and Genoa Gulf [7]. The increasing trends in frequency of Tropical-Like Cyclones (TLC), also referred to as Medicanes (Mediterranean Hurricanes), on the southern-central Mediterranean lead to increased probability for the development of very high storm waves. In recent years, Medicanes “Qendresa” that on 7 November 2014 affected Malta and Sicily [8], “Zorba” that on 29 September 2018 affected Ionian Sea–Peloponnese (Greece) (see at link: https://www.youtube.com/watch?v=hco9DNoc1vY accessed on 6 September 2021), and “Ianos” that on 18 September 2020 affected Ionian Sea and Western coast of Greece [9] originated huge waves striking the coast. The magnitude of sea surface elevation extremes has increased variably in different Mediterranean regions (mostly Southern Adriatic, Balearic, and Tyrrhenian Sea) during the 21st century [6].
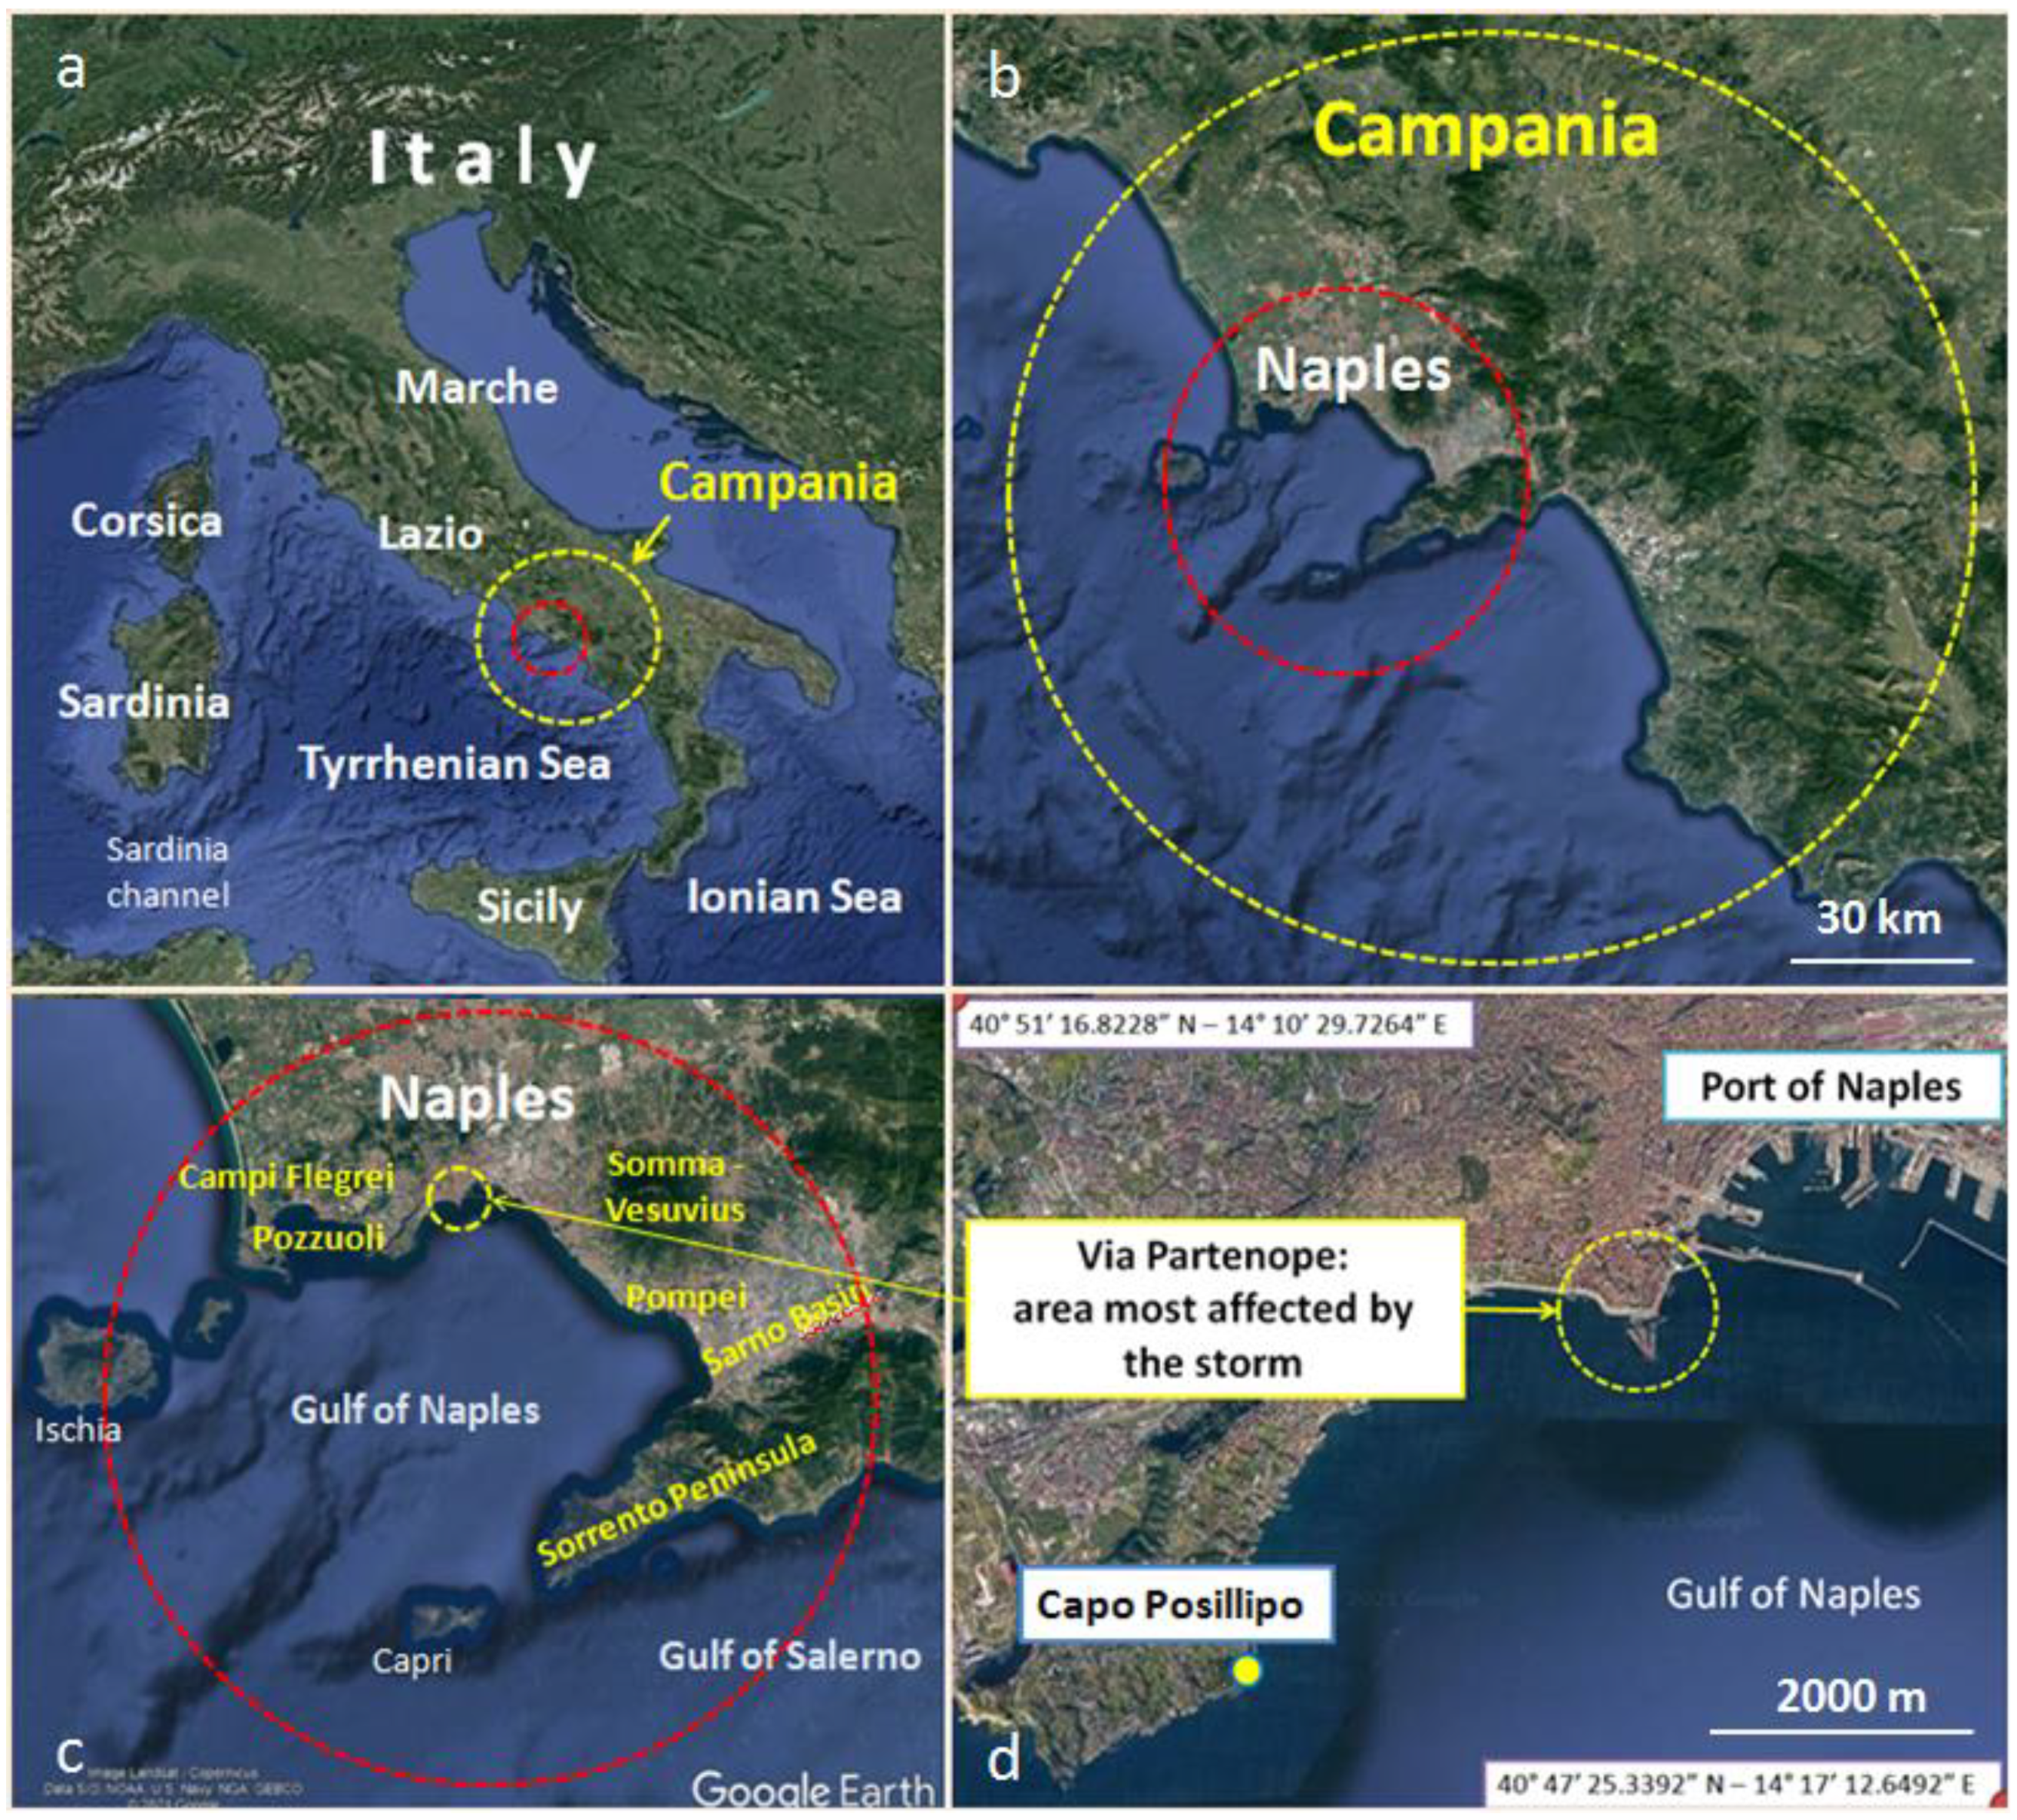
The Gulf of Naples area (Figure 1) is affected by subtropical dry-summer climate (Mediterranean climate Cs, according to Köppen-Trewartha classification [10]), characterized by dry summers, wet and rainy winters with rainfall amount more than three times compared to the summer period [11]. The surface marine circulation of the Gulf of Naples is mainly dominated by the local wind field [12,13,14]. During the winter months, the most intense winds come from the NNE and NE directions. In spring and fall, the main directions are NE and SW, whereas, during summer, winds are generally weaker than the rest of the year [15]. This general wind regime is associated with numerous low-pressure systems passing over the Gulf of Naples area, with frequent thunderstorms and wind events during winter and fall. In contrast, in spring and summer, the presence of the Azores and African anticyclones induces a stable and moderate breeze system [16,17]. The sea wave characteristics in the Gulf of Naples denotes a strong seasonality, characterized by strong swells in winter and fall and lower wave heights in spring and summer [12,15,18]. Based on analysis using of HF radar data, the average wave heights in the inner sub-basins of the Gulf of Naples range from 1.19 m to 1.70 m, whereas the Tyrrhenian offshore areas yield values ranging from 1.77 m to 2.38 m, with typical wave periods between 6 and 8 s [19]. Storms in the Bay of Naples mainly occur during autumn and winter. They tend to involve large areas and may last in the offshore sectors for a significant time, so that large waves can develop. These storms are frequently of extratropical type (i.e., related to the oscillation of the polar front), even though, in some cases, storms can also be driven by Mediterranean low-pressure systems [20]. During such extreme events, wave heights can be significantly higher than average records and often exceed 3 m. Under these circumstances, storm waves directly affecting the waterfront of Naples and its infrastructures are likely to result in very high levels of coastal hazards [21].
This study presents a multidisciplinary analysis of a severe sea-storm that occurred during the last days of 2020 producing exceptionally high damage along the waterfront on Naples (Via Partenope) (Figure 1). The aim of this research is to document the importance of the local and microscale hydrodynamic processes in controlling the wave directions near the coastline and enhancing the mean wave height. A better understanding of the processes leading to these effects may provide a support to better address design engineering criteria for future coastal planning and protection.

2. Material and Methods

This study is based on integrated data sets and methods including analysis of meteorological data acquired by weather stations, wave measures by sea buoy, wind and wave analyses, and interpretation of detailed digital elevation model (DEM) and orthophoto derived by UAS (Unmanned Aircraft System) surveys.
The first step in the analysis of the 28 December 2020 sea storm event has been the reconstruction of the meteorological scenario both at a large scale (Europe and central Mediterranean area) and at a local scale. The large-scale meteorological study has been carried out based on forecasting and reanalysis maps derived by meteorological models and EUMETSAT satellite images (see link at: https://www.eumetsat.int, accessed on 6 September 2021). These data are available from open access International Meteorological Service [22] and have been used to reconstruct the main features and evolution of the atmospheric systems that caused the storm event discussed in this study, with particular attention to the evolution of wind intensity through time. Local meteorological data, along with tidal and wave data used for this research, have been collected from various institutions:
-
“Consiglio Nazionale delle Ricerche-Istituto di Scienze Marine” (CNR-ISMAR)–meteorological data by a Campi Flegrei network [23];
-
“Istituto Superiore per la Protezione e la Ricerca Ambientale” (ISPRA)–“Rete Mareografica Nazionale” [24]; meteorological and tidal data in the Port of Naples;
-
“Istituto Nazionale di Geofisica e Vulcanologia-Osservatorio Vesuviano” (INGV-OV)–“MEDUSA Project”-tidal data by instrumented buoys operating in the Gulf of Pozzuoli [25]; and
-
University of Naples “Parthenope”–waves data by instrumented buoy operating in the Gulf of Naples (courtesy of prof. G. Budillon, Parthenope University).
The CNR-ISMAR meteorological monitoring network (Table 1) is composed of four weather stations, equipped with Davis Instruments–Vantage Pro2 model [26], located along the coastal area of the Naples district (Figure 2). The network has been implemented to investigate the influence of meteorological factors on geomorphological coastal processes, such as cliff retreat, landslides, beach erosion, and sea storms. The four weather stations (WS) are described in Table 2 and Table 3. The Integrated Sensor suite detects temperature, relative humidity, barometric pressure, rain, and wind (speed and direction).
The sensors of ISPRA meteorological and tidal station WS-05-Port of Naples (40°50’29.06” N–14°16’09.10” E) are described on the institutional ISPRA website and include an ultrasonic anemometer [27]. The characteristics of the tide gauge sensor of the INGV-OV buoy in the Gulf of Pozzuoli (40°48’32.47’’ N, 14°8’39.33’’ E) are documented on the institutional INGV-OV website (Medusa Project) [25]. Sea waves data are recorded by an active buoy managed by the University of Naples “Parthenope”, located in the southern part of the Gulf of Naples (Figure 2) off the coast of Massalubrense (40°37.127’ N, 14°19.415’ E; bathymetry: −50 m). The buoy has a floating body in polyethylene and includes a central metal structure on which the different modules are installed. The system is equipped with a datalogger for data acquisition; it records the measurements on the internal memory and transmits data in real time to a remote computer through a UTMS (Universal Mobile Telecommunications System) modem. The sensor mounted on the turret of the buoy body is based on a GNSS (Global Navigation Satellite System) receiver for the detection of height and direction of the waves. The buoy presents a main exposure angle optimized for wave directions somewhat different from that of study area; therefore, this study is based on an estimation of sea wave motion, based on the transferring of energy from wind to sea surface. The sites of installation of all sensors are reported in Figure 2.
The marine sector where waves propagate before impacting the seawall of Via Partenope (
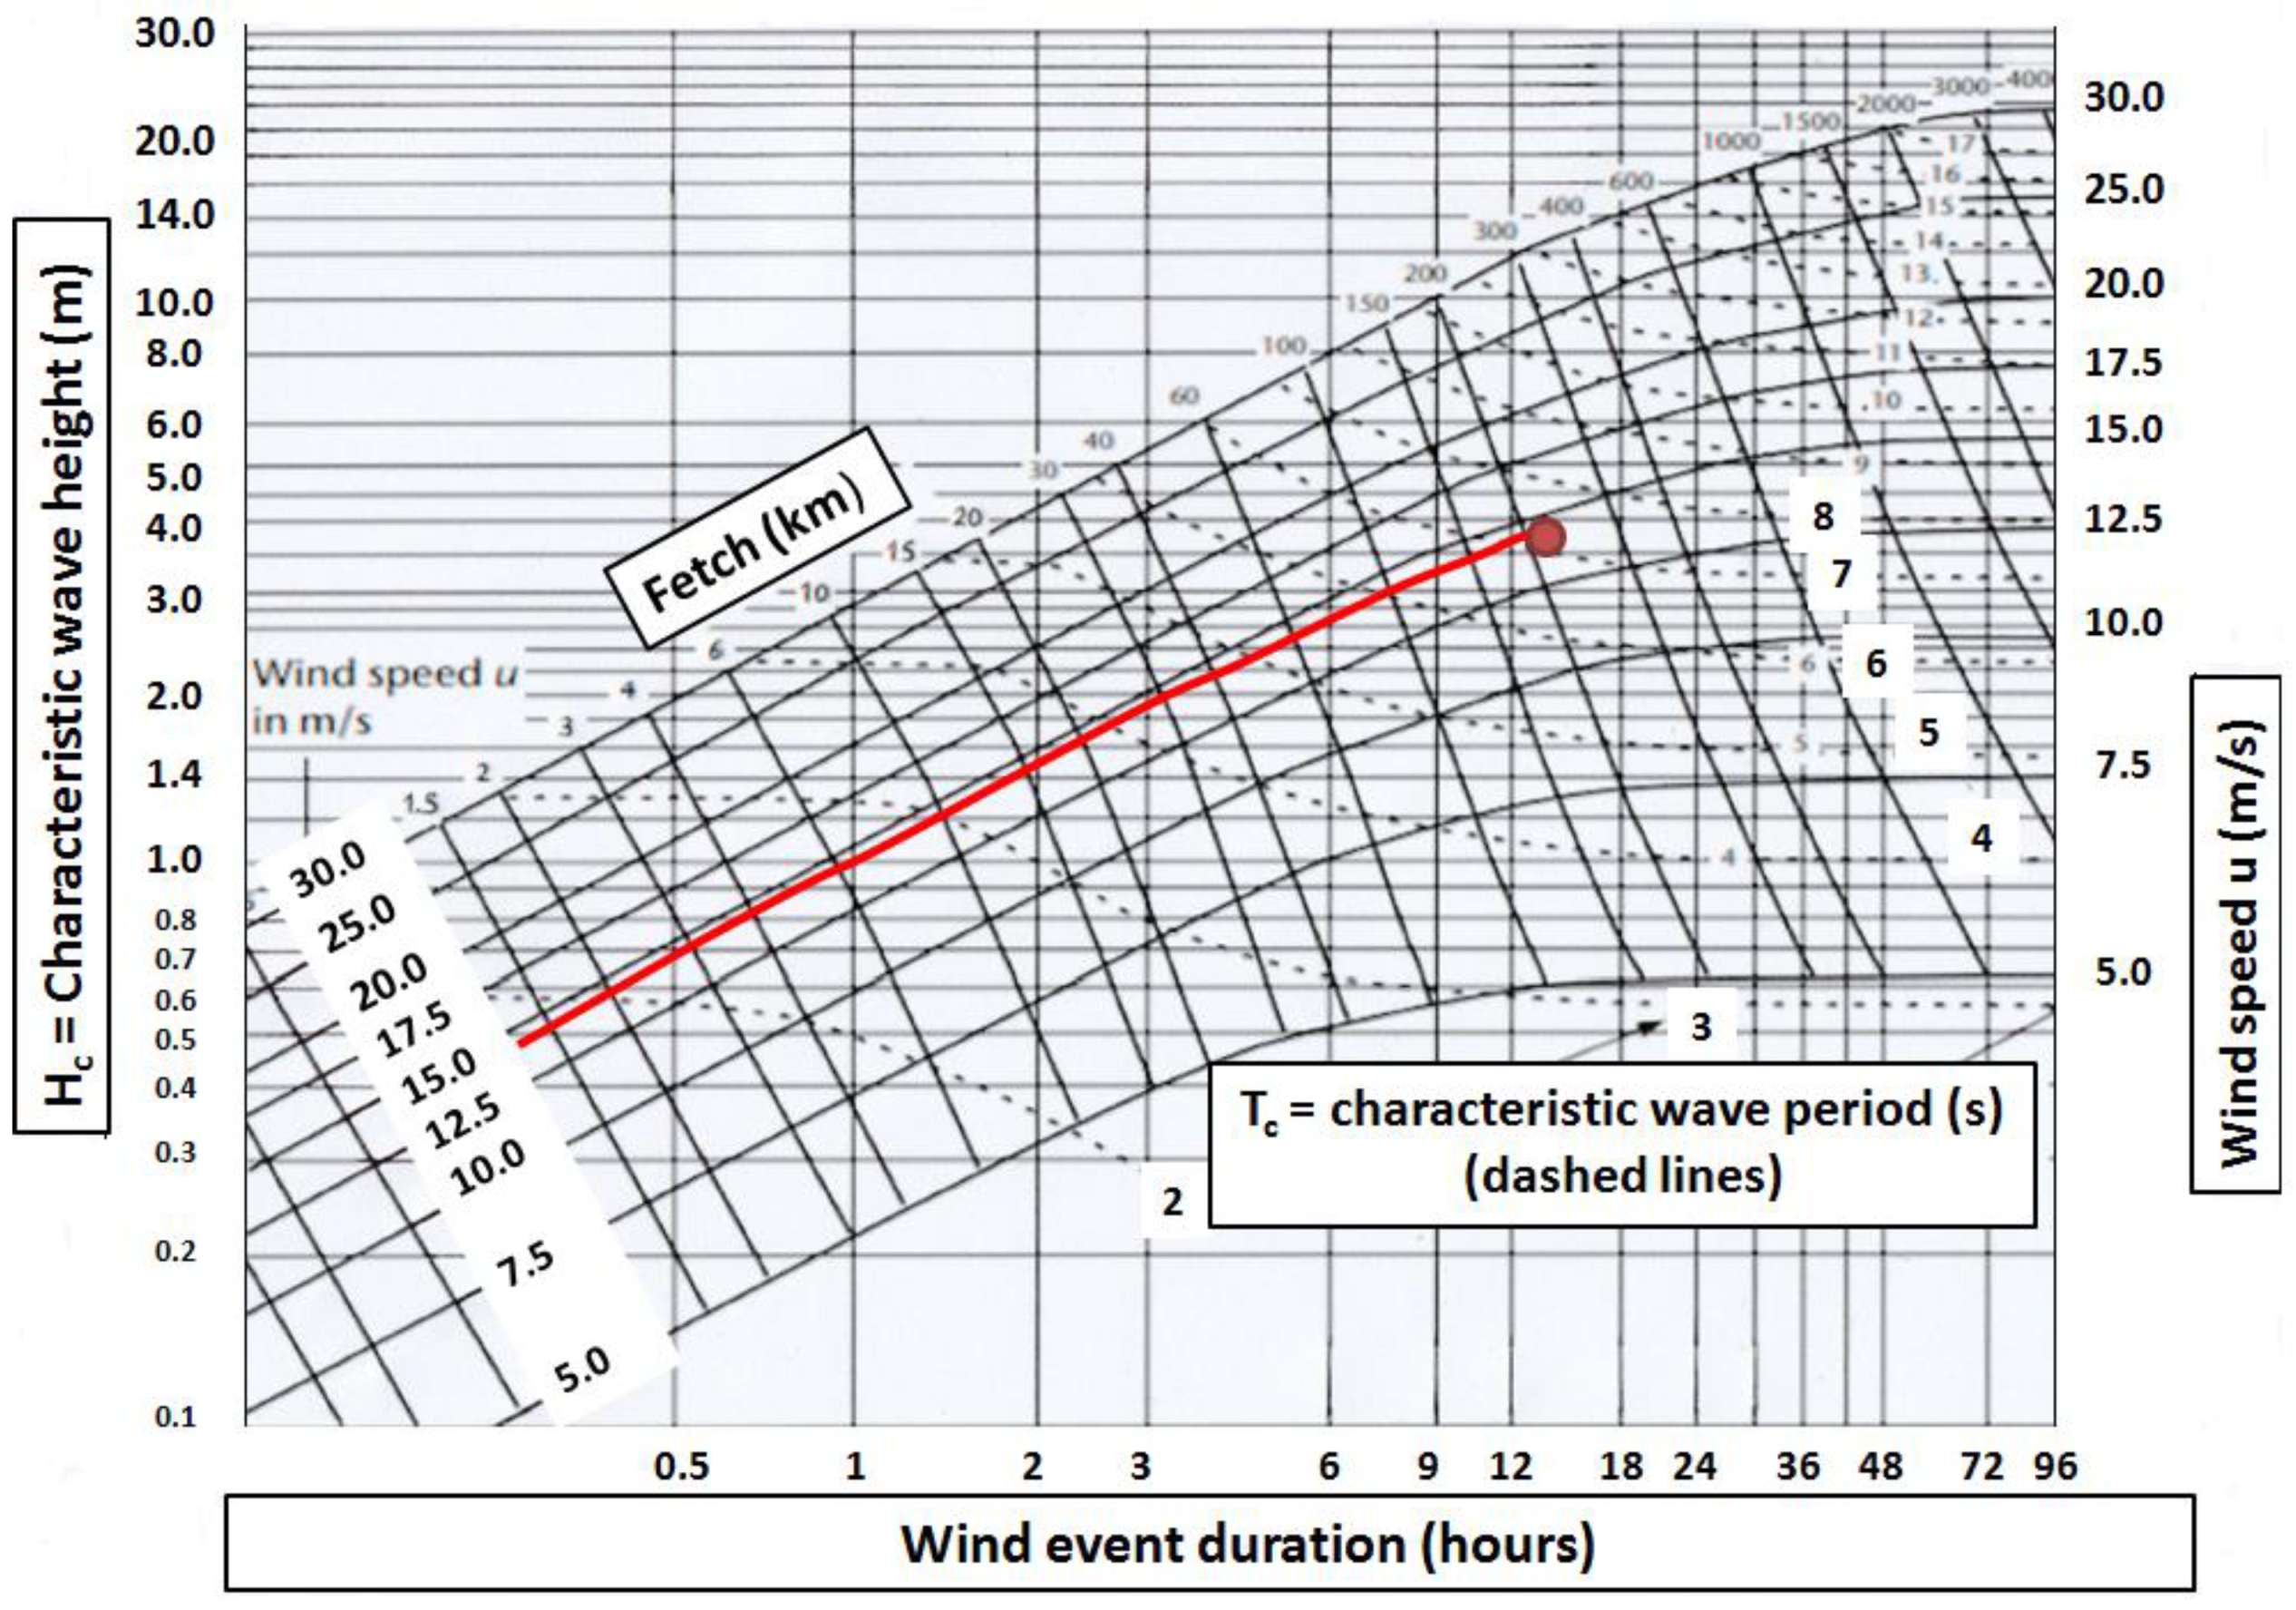
Figure 1d) is characterized by a complex seabed morphology. The fluid dynamic processes affecting wave motion, depending on the local seabed morphology, sharply differs from the case of a sandy coast with a medium or low slope. The methodological approach applied in this study takes into account this situation. In detail, spilling breaking type and refraction phenomena have been considered absent or negligible. The three parameters involved in the process are wind speed, wind duration, and fetch length. In our analysis, Dorrestein nomogram [28] has been used. The most important wave parameters evaluated through the Dorrestein nomogram are Hc (characteristic wave height) and Tc (characteristic wave period). They are considered active up to the depth of −10 m and then undergo a breaking process as the depth decreases below −10 m. As the breaking process occurs very close to the coast, the energy dissipation is not significant.
Characteristic and significant wave motion are model descriptions useful to represent the real wave motion and can be adopted as proxies of the average effects produced by the wave process on coastal areas. As “characteristic wave height Hc”, we indicate the height of most developed waves appearing during the growth of the swell, characterized by relatively regular period and height. As “significant wave height Hs”, we denote the height (constant) of a regular stationary sequence of waves (sinusoidal transverse profile), with height equal to the arithmetic average of the highest third of the waves that compose a specific marine event and cross a given marine area without interference between waves and seafloor.
Gröen and Dorrestein [28] developed a set of curves showing the characteristic height Hc and period Tc versus fetch and duration. These graphs are distinct from significant height (H1/3) and mean period (Tz). There is uncertainty concerning the relationship between the visually and instrumentally derived quantities, but some bias (Hc and Tc both being slightly higher than H1/3 and Tz, respectively) may be likely involved when using this type of graph. However, systematic errors are generally small compared with the random errors in individual observations and the differences are negligible for all practical purposes [29]. For the estimation of the characteristic wave height Hc in relation to the wind force, known the duration of the anemometric event and the fetch, we used the Gröen-Dorrestein nomogram [28] and cross-checked the values through Breugem-Holthuijsen nomogram [30].
UAS (Unmanned Aircraft System) photogrammetry combined with the Structure from Motion (SfM) technique [31,32] has been used to analyze the seawall morphology along Via Partenope sections (Figure 1d). These methodologies represent a well-established method for mapping and creation of digital elevation models (DEMs) and ortho-images. In order to investigate the coastal section involved by the sea storm, a DJI Phantom 4 RTK aircraft with an on-board RTK (Real Time Kinematic) has been used to perform all the aerial imagery acquisitions.
The DJI Phantom 4 RTK UAS mounted with a camera equipped with FC6310R lens (f = 8.8 mm), resolution of 5472 × 3648 pixels. The GNSS RTK equipped UAS simplified the construction of highly accurate digital models through SfM photogrammetry, thus avoiding the need for ground control points (GCPs) [33] that can be difficult in a busy urban context. In this way, the high precision GNSS, allows the detection of the 3D position of the camera at the time of each capture, within a few centimeters. The position of the camera can be estimated automatically by the firmware and the coordinates are stored internally. Exif metadata have been referenced to the camera. The flight altitude was set to 50 m above the ground with a vertical image acquisition axis and Ground Sampling Distance (GSD) of 1.21 cm/pix. The GSD represents the distance between the centers of two consecutive pixels in the image on the ground [34]. For a given flying height H (m), the GSD is given by:
GSD = H × P/f,
where P is the pixel size of the sensor (micro), and f is the focal length.
Ninety-nine images were acquired following a single–grid plan, thus collecting pictures along a given direction only. In this case, the dataset consisted of nadiral imageries, and the entire coastal section was mapped. The SfM photogrammetric processing was performed by Agisoft Metashape® Professional software package [35].
The SfM-based photogrammetric processing resulted in a dense cloud point, 3D model, 2D orthomosaic, and DEMs data from the set of overlapping images for the area of interest. The obtained final value of root mean square error (RMSE), expressed in pixel units, was below 1 pixel RMSE for all the performed projections. The high resolution of the orthophotos and the accuracy of the entire post photogrammetric processing allowed for obtaining precise measurements within an accuracy range of ±2 cm.

3. Study Area and Historical Events

On 28 December 2020, the Tyrrhenian coastline of the Campania region (Figure 1) was struck by a severe sea storm, due to a deep Mediterranean low and related cold front, moving from NW to SE. Particularly, the Gulf of Naples was heavily involved during this sea storm. The recorded wind gusts caused widespread damages to coastal infrastructures, especially because of the action of associated huge sea waves.
The Gulf of Naples represents a marginal basin of the south-eastern sector of the Tyrrhenian Sea (Figure 1c). It is characterized by a complex bathymetry, including two deep canyons, and submerged volcanic structures [18]. The southern limit of the Bay is formed by the Sarno River plain and the Sorrento peninsula, represented by the carbonate reliefs of the Lattari Mountains (Figure 1c). The entire coastal area, from Pozzuoli to Naples, Pompei and Sorrento is heavily urbanized and inhabited by ca. 1.5 million of people that cause an intense anthropic pressure to coastal and marine environments [36,37]. Despite this high anthropic impact, the coastal part of the Gulf of Naples is characterized by the occurrence of habitats with high natural value [38] and numerous coastal archaeological sites [39,40]. In this sector, the former beaches and natural environments have been lost due to urbanization and the shorelines are stabilized with revetments and seawalls. The waterfront construction was necessary to protect local houses and the several economic and touristic activities along this coastal zone. The morphology of Naples coastal sector is mainly characterized by volcanic landforms with the Campi Flegrei caldera hills to the north-west and the Somma-Vesuvius volcanic complex to the east, minor coastal plains associated with fluvial processes (e.g., the Sebeto plain), and erosive traces of wave action (cliffs, erosion terraces), resulting in alternating small bays and cliffed promontories [40]. Depositional sequences of volcaniclastic deposits, reworked by alluvial and/or colluvial processes, are present in the coastal plain of Chiaia [41]. This area is characterized by an overall subsidence in the last 4000 years with a prevailing prograding/aggrading trend due to the sedimentary input coming from the hillslopes and significant anthropic pressure [40,41]. In the near high rocky coast sector, the Neapolitan Yellow Tuff (NYT) unit crops out along the paleo cliffs of the Pizzofalcone promontory and Castel dell’Ovo islet (Figure 3a).
The study site is located along the Chiaia coastal segment of the Naples seafront between Castel dell’Ovo and Mergellina, particularly at Via Partenope, the area most intensely hit by the storm (Figure 1d).
The dominant waves mainly come from the SW sector with fetches less than 400 nautical miles for the Gulf of Naples. The medium wave height generally ranges between 0.9 and 2.2 m, although heights of up to 4.7 m have been recorded, especially during the winter. These values may double with a critical wave height of 7.4–8.4 m if we consider the recording data in a period of 50 years for the widest fetch [42]. Extreme waves characteristics evaluated for Via Caracciolo and Via Partenope sectors and for T = 100 years (T = return period) present a significant wave height Hs =2.55–2.91 m for the wave exposure angle 165°–225°N [42]. Concerning storm surge processes triggered by extreme swells, local authorities (e.g., Autorità di Bacino Nord Occidentale della Campania) [43] evaluated Hs100 = 2.91 m and the “Run up” R100= 3.95 m a.s.l. over coastal infrastructures for T = 100 years.
The local marine setting, where waves propagate before affecting the seawall of Via Partenope, is characterized by an articulated seafloor morphology and by the occurrence of Castel dell’Ovo islet. In front of “Castel dell’Ovo”, the water depth is greater than −10 m up at ca. 150 m off the tuff cliff, and this depth almost reaches the base of the Castel dell’Ovo western bastion (Figure 3a).
After 1950, sea storms of intensity similar to the one that occurred on 28 December 2020 have affected the Via Caracciolo–Via Partenope waterfront in three cases, namely on 4 November 1966, 23 December 1979, and 11 January 1987 (Figure 3).
The 1966 sea storm event in the Gulf of Naples was generated by the same cyclonic system triggering the great historical flood of Florence and the highest tide ever recorded in Venice (+194 cm) [44]. Long lasting south-easterly winds affected Tyrrhenian and Adriatic Seas along the direction of their maximum extension, leading to the development of large waves (Figure 4b). The 1979 event was represented by a nocturnal south-east windstorm (“Scirocco” wind), that concentrated its action in the Mergellina area with devastating effects on the road platform of via Caracciolo and the sinking of numerous boats and a hydrofoil in the Mergellina harbor (Figure 3c). The third event occurred on 11 January 1987 (Figure 3d), with a southerly wind direction in the phase of maximum intensity. This storm presents a clear analogy with the one observed on 28 December 2020, even though the meteorological scenario over Europe was quite different (Figure 4).

4. Meteorological Analysis of the 28 December 2020 Sea Storm Event

4.1. Meteorological Background at Synoptic Scale

The analyzed meteorological event was triggered by an intense storm coming from the Northern Atlantic, generated on 26 December east of Greenland and then rapidly moving toward the British Isles and North-western Europe. Satellite images and meteorological maps (sea surface barometric field and 500 hPa geopotential height) well represent the rapidity in translation of the system from the genesis area to the Mediterranean (Figure 5).
Meteorological map and satellite images from 26 December 2020-12:00 UTC (Figure 5a,d) show the low pressure centered south of Iceland, with a barometric minimum of 965 hPa in the inner part and a 500 hPa geopotential height less than 4850 m over Iceland.
Satellite image relative to 27 December 2020-12:00UTC (Figure 5b,e) shows the low pressure centered over Scotland, with a barometric minimum of 958 hPa at the center and a 500 hPa geopotential height equal to 4900 m. These values are representative of an intense mid latitude cyclonic system.

4.2. Meteorological Analysis at Regional Scale

The satellite image and sea level pressure map (Climate Forecast System-CFS Reanalysis) relative to 28 December 2020-12:00UTC (Figure 5c,f) show that the center of the cyclone was located over northern France, and it was characterized by a sea level pressure equal to 972 hPa and a 500 hPa geopotential height equal to 5060 m. The mesoscale scenario triggering the analyzed meteo-marine event can be associated with the rapid barometric fall over the central Mediterranean, induced by the direct advection of cold arctic air masses. The dynamics of cold air affecting the northern side of the Alps led to the formation of a secondary low pressure over the Ligurian Sea (Genova Low), with a minimum value of 986 hPa at 12:00 UTC. Over the Tyrrhenian Sea, we can observe very close isobars associated with strong SW currents in the low troposphere, active since the early morning of 28 December 2020. Satellite images relative to 12:00 UTC show the cold front extending from Gibraltar to the Balearic Islands up to Corsica and northern Italy (Figure 5f).
The synoptic wind force is directly related with the horizontal barometric gradient that reached its extreme values, while the maximum gusts occurred on the coastal strip of Naples. Barometric gradient (G) is the physical quantity equal to the ratio between the difference in pressure (ΔP) between two points, A and B, of the Earth’s surface (at the same elevation above sea level or considering pressure in reference to the sea level):
G = ΔP · D−1,
where: ΔP = PA–PB; D = distance between A and B (expressed in km).
Extracting the barometric data from the map in Figure 6b, we have a barometric difference ΔP between the extreme northern part of Campania (992 hPa) and Capo Palinuro (1002 hPa) of about 1000 Pa at a distance D of 190 km, resulting in an average barometric gradient G of 5.26 Pa·km−1. This extreme value is very often associated to storm winds. At 18:00 UTC, the cold front was going to cross the Campania region and was preceded by most intense SW storm gusts. The cyclonic system was very complex, in advanced stage of development with occluded fronts over France (Figure 7).

4.3. Anemometric Event Analysis at Sub-Regional Scale

The diagrams in Figure 8 report wind data from CNR-ISMAR weather stations and show the average wind speed measured during the 10 min before the data sampling time (diagrams on the left) and the maximum gust speeds (diagrams on the right) over the same time interval.
The increase in wind intensity started just after 00:00 UTC and is well depicted by diagrams: at about 11:00 UTC, the wind speed reaches a relative maximum, then decreases up to about 13:00 UTC; later, the wind speed increases again, reaching its absolute maximum at about 19:00 UTC. The wind direction was between S and SW for the entire storm event. The classification of an anemometric event using the Beaufort scale [46] documents the relation between wind speed (and, therefore, its dynamic pressure) and the effects caused by the wind on the environment. The anemometric event that occurred on 28 December 2020 was characterized by gusts of maximum intensity (Force 11-violent Storm, Beaufort scale) at the location of Lago Patria, where wind speed maxima typical of a low-intensity hurricane were reached. On the other two locations, strong gale intensity was recorded.

5. Sea Conditions Analysis of the Sea Storm Event of 28 December 2020

The coastal area of Naples hit by the sea storm is showed in Figure 3a. The entire waterfront of Via Caracciolo/Via Partenope was affected by the storm, but the effects appear to increase in magnitude from Mergellina towards Castel dell’Ovo (from West to East), likely due to the relatively lower protection offered by the Posillipo promontory to the eastern part of the waterfront with respect to specific direction of wave motion (SSW-NNE) (Figure 9). Via Partenope was the waterfront area most affected by damage, as highlighted in yellow in the inlet image of Figure 10. The main wave exposure angle is the angular sector encompassing the directions from which the largest waves can affect the study area. This angle (in reference to the north) is determined by taking the half-lines tangent to the promontories that mostly restrict the direction to the open sea, in our case, the western margin of Capri Island (named Punta Arcera) and Capo Posillipo (Figure 9).
Considering the coastline point P0, in correspondence of “Via Partenope”, we defined the main wave exposure angle relative to point P1, where it is possible to consider undisturbed the wave motion, due to the absence of wave energy dissipation by interference with the seafloor. These last elements modify the direction of propagation of wave fronts due to diffraction phenomena. This point is located at the intersection between the axis of the main wave exposure angle and a water depth H of −34 m (Figure 10).
The value H = −34 m is equal to the maximum characteristic semi-wave length (L/2) measured during the observed meteorological event:
L = 1.56 Ts2 = 1.56 · 6.62 = 68 m.
In the case of the study area, the geographical fetch is wide. Most of the directions included in the sector relative to point P1 intercept the coasts of North Africa (with fetch extending over 600 km) and the northern coasts of Sicily (with fetch extending approximately 300 km). This means that a large possibility exists of wind energy transfer to the sea surface and consequent increase of wave dimensions (length and height).
In the Mediterranean area, the barometric lows generating the major wind events, and greatest wave heights, have not a full compliance with the definition of fetch. Particularly, wind usually does not have constant direction and intensity over the entire length of the fetch. For this reason, the geographical fetch has been locally limited to the value of 250 nautical miles (about 460 km) (Table 4). The barometric conditions on 28 December over the central Mediterranean showed a high rate of exploitation of fetches in the directions of the main wave exposure angle (Figure 11), as the anemometric event discussed in this study has constantly maintained a direction of about 210°. In this condition, the role of wave motion from angular sectors external to the main wave exposure angle is not significant, which makes the evaluation of the effective fetch unnecessary.
The wind event triggering the sea storm began in the early morning of 28 December. For convenience, we consider 06:00 UTC as the onset time of the event, when the anemometric diagrams (Figure 8) indicate a significant increase of the wind speed. Wind intensification occurred during almost the entire morning and afternoon of 28 December 2020, until 19:00 UTC. In detail, two distinct wind corridors were active (Figure 12).
Corridor 1 is relatively wide and is characterized by high speed, SW winds, whereas corridor 2 is relatively narrow and is dominated by SSW winds. Both corridors pointed towards the southern coastal area of Lazio at 15:00 UTC while approaching the coasts of Campania. These corridors acted extensively on the fetches of the main wave exposure angle of P1. The convergence of two different wave motions likely caused a concentration of the sea storm energy, with enhancement of wave motion and the possible development of rogue waves due to random interaction of the two distinct wave trains.
The maximum development of wave action occurred around 19:00 UTC, following a drop in wind intensity when the waves became regular in their profile, and the wave breaking process started, mostly due to the interaction of wave motion with the seabed, without substantial contribute of windshear (Table 5). This setting favored the concentration of energy in the wave motion and a wave geometry with almost undulatory profile before the breaking process. At the beginning of the windstorm event (t = 0), we consider the wave motion in the Gulf of Naples equal to the one recorded by the Parthenope University ondametric buoy for the time interval before 06:00UTC:
-
Hs (m) = 1.00,
-
Ts (s) = 4.1 → L = 25 m,
-
Dir (°) = 264.
The wave motion is the result of the previous meteo-marine phase, with the presence of swell waves of modest steepness (low ratio H/L), as confirmed by the analysis of the Gröen-Dorrestein [28]. In fact, a new forming wave characterized by a height H = 1.00 m, is characterized by a period T < 4 s (and shorter wavelength) for duration of the wind event D < 24 h. This is up to the intensity of 30 m s−1, with delayed times for reaching the height of H = 1.00 m, depending on the intensity of the wind event and the delayed minimum fetch. The swell height usually decays about 25% in 12 h, and 40% in 24 h [29]. Given the duration of 14 h for the analyzed wind event, we consider that the initial wave motion, after 14 h, is reduced by 30%, as shown in Equation (4).
Hs,in (t = 0) = 1.00 m → Hs,fin (t = 14 h) = 0.70 m.
The starting of the anemometric event induces the formation and the progressive development of new waves. According to the different period of the characteristic waves (previous and recent waves), the sea surface appears rather chaotic, with irregular distribution of waves with various height and period, but, as the waves grow, the development of characteristic waves is observed. The meteorological stations selected for the analysis of the anemometric event and used to evaluate the meteo-marine conditions in front of Via Partenope, are Capo Posillipo–ISMAR (WS-03) and Port of Naples–ISPRA (WS-05) (Figure 2). The choice is based on the exposure of these two weather stations, on their relative proximity to the study area that is located along the line connecting WS-03 and WS-05.
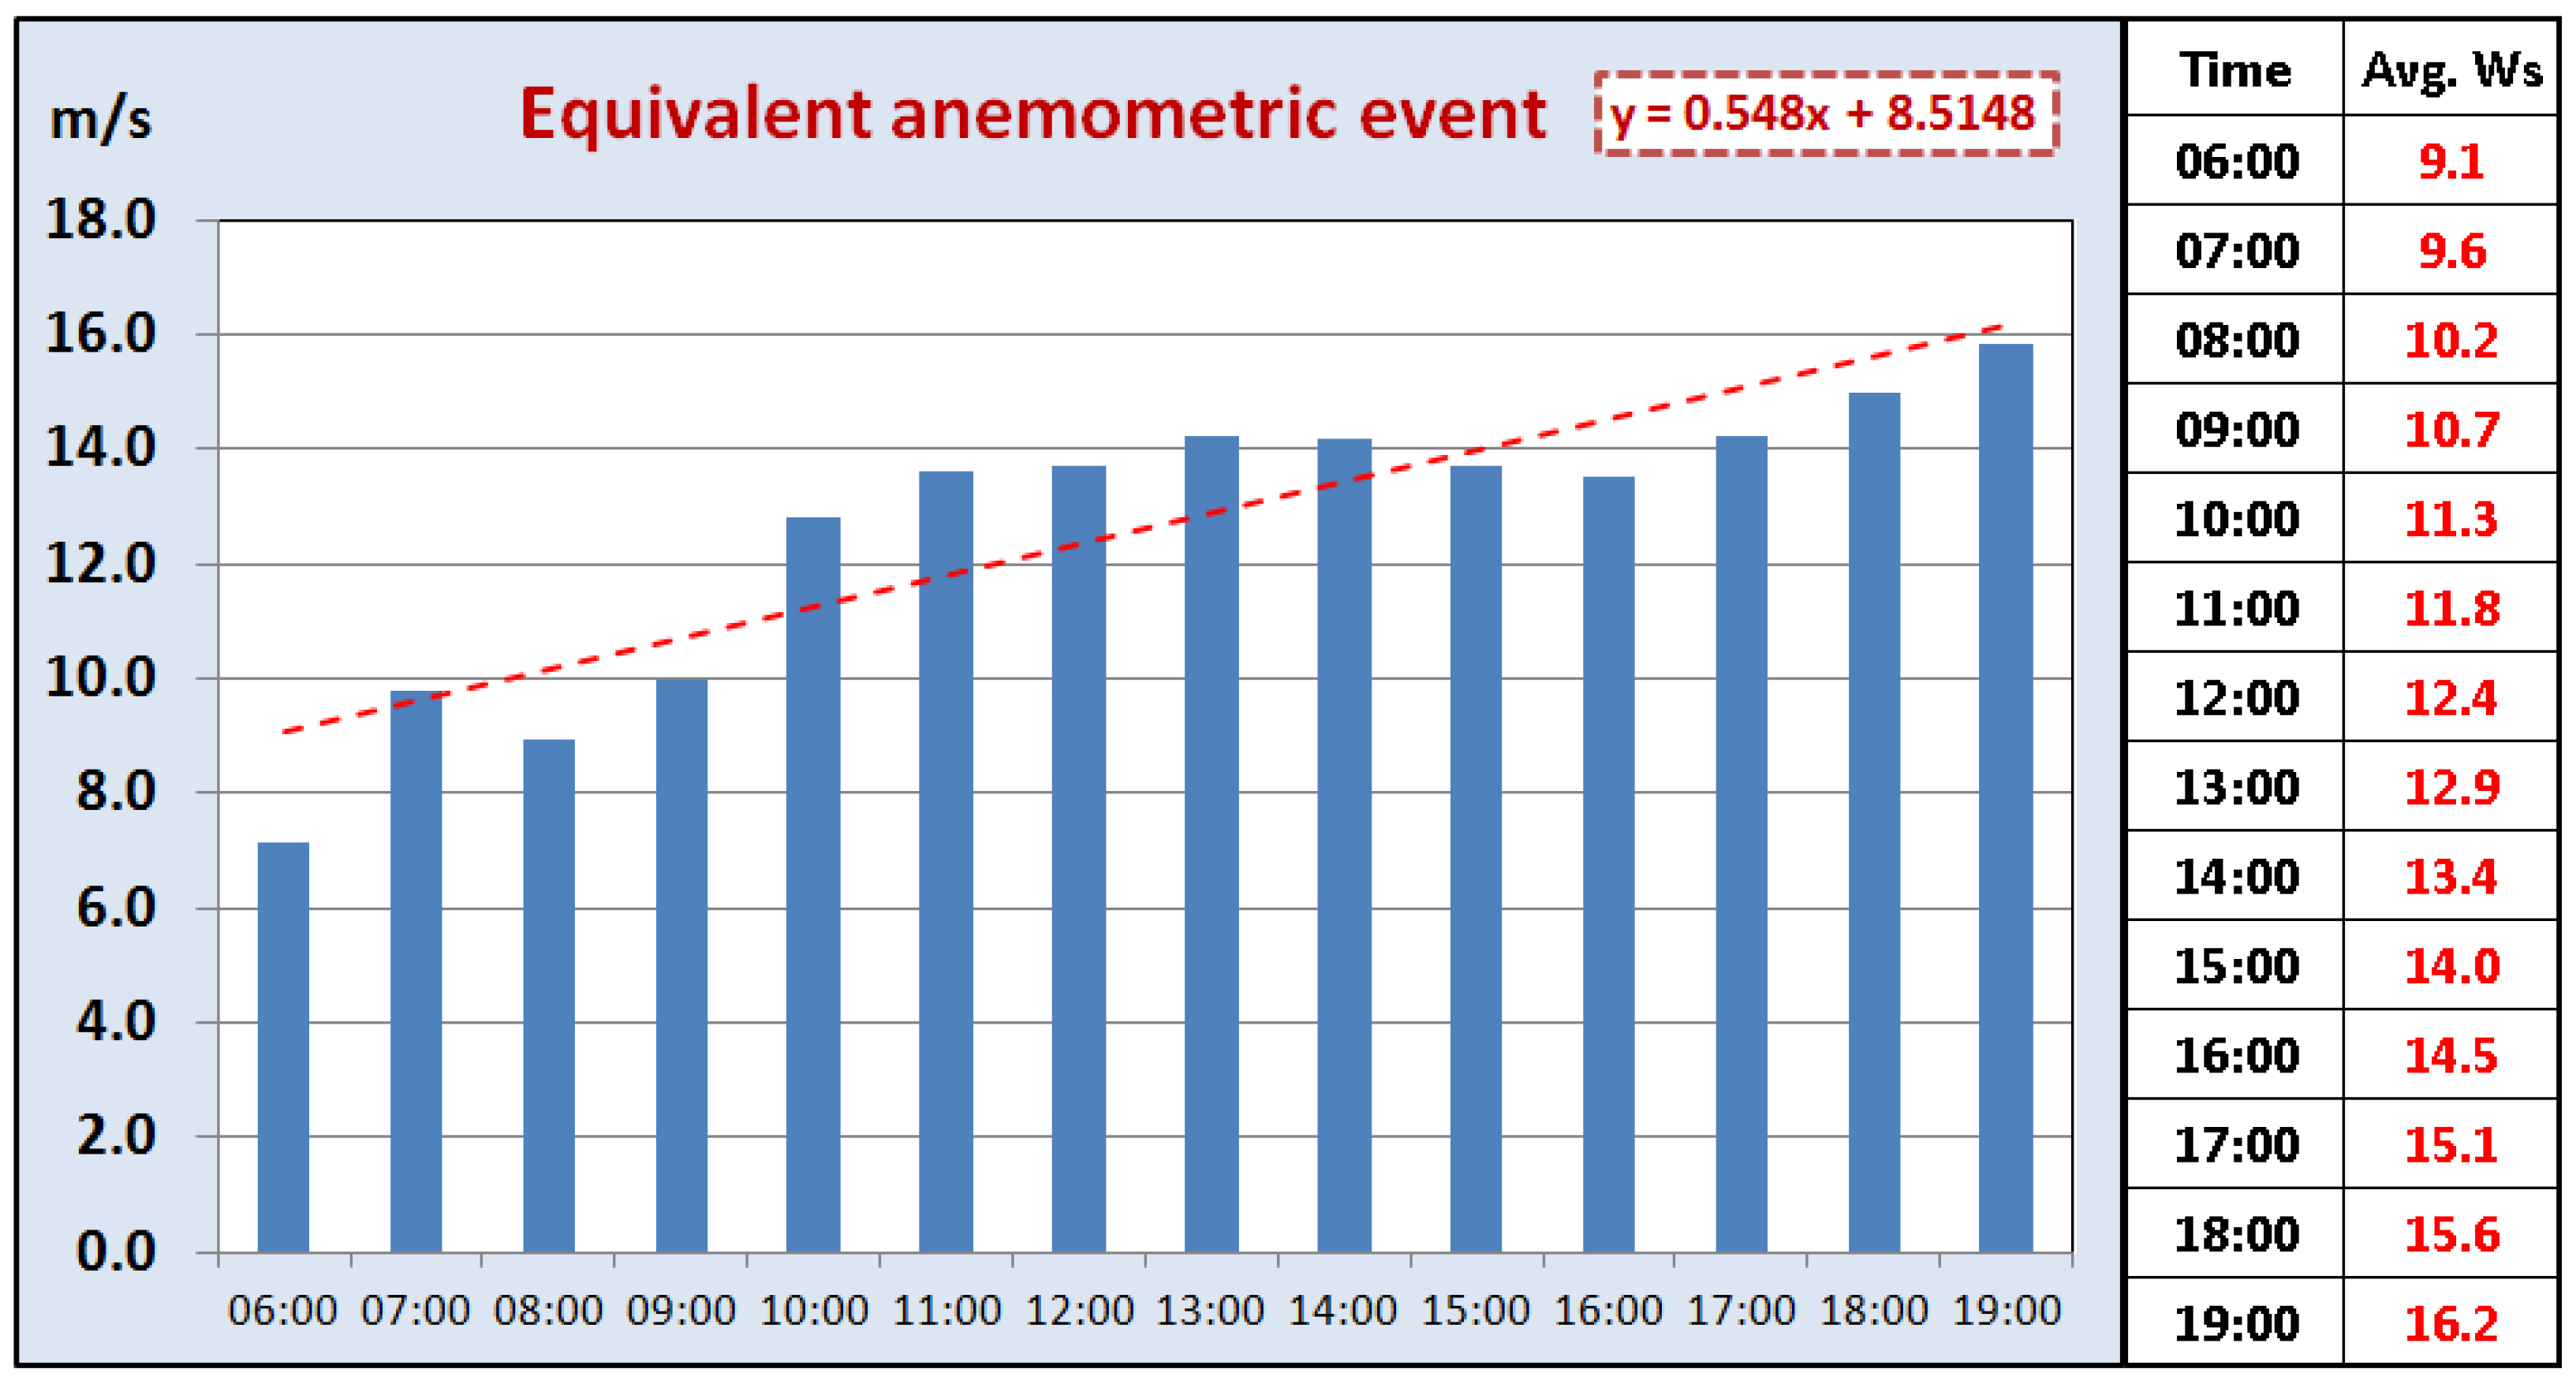
The real anemometric event, given by the average values of the two weather stations (Table 6), is transformed into a step diagram (Figure 13), composed of 14 sub-wind events, each of 60’ in duration (from 06:00 to 19:00 UTC), with a constant wind speed equal to the average value in that specific time interval. Anemometric data (Figure 13) showed a freshening wind at constant direction, with wind speed that gradually increased from 06:00 UTC to 19:00 UTC without major changes. This almost linear progression allows for a linear interpolation of detected wind speeds over the entire duration of the event (14 h). Hence, it is possible to estimate the characteristic wave height by subtracting 25% of the amount of wind speed increase from the highest wind velocity reached at the end of the storm event and work on the obtained value [29]. The interpolated wind speeds span from 9.1 m s−1 (t = 1) to 16.2 m s−1 (t = 14) (see Figure 13); then:
[16.2−0.25 (16.2−9.1)] = 14.4 m s−1.
For the following analysis, we used a constant wind speed of 14.4 m s−1 over a duration of 14 h.
The reconstruction of the deep-water wave motion (offshore conditions) through the Dorrestein diagram (Figure 14), using the value above calculated (14.4 m s−1), allows estimating the characteristic wave height:
-
Hc = 3.80 m,
-
Tc = 7.3 s,
-
Hmax = 1.29 Hs = 4.90 m, and
-
Tmax = 7.8 s.
These wave height values are confirmed by Breugem and Holthuisjen (2007) wave growth nomogram (Figure 15), that allows evaluating the significant wave height in:
-
Hs = 3.80 m.
The absolute maximum height is obtained by adding this value to the wave height recorded at the end of the previous anemometric event, assuming the principle of superposition of effects:
Hc,fin = Hc + Hs,fin = 3.80 + 0.70 = 4.50 m,
H1 = Hmax + Hs,fin = 4.90 + 0.70 = 5.60 m.
The data measured by the Massalubrense buoy of Parthenope University (Table 5) are significantly lower than the ones extracted from the Gröen-Dorrestein nomogram. This depends on the smaller fetch as a consequence of the sheltering effect of Capri Island from S-SW winds. Conversely, when S-SW wind is active, unlimited fetches are available at via Partenope.

Tidal Analysis

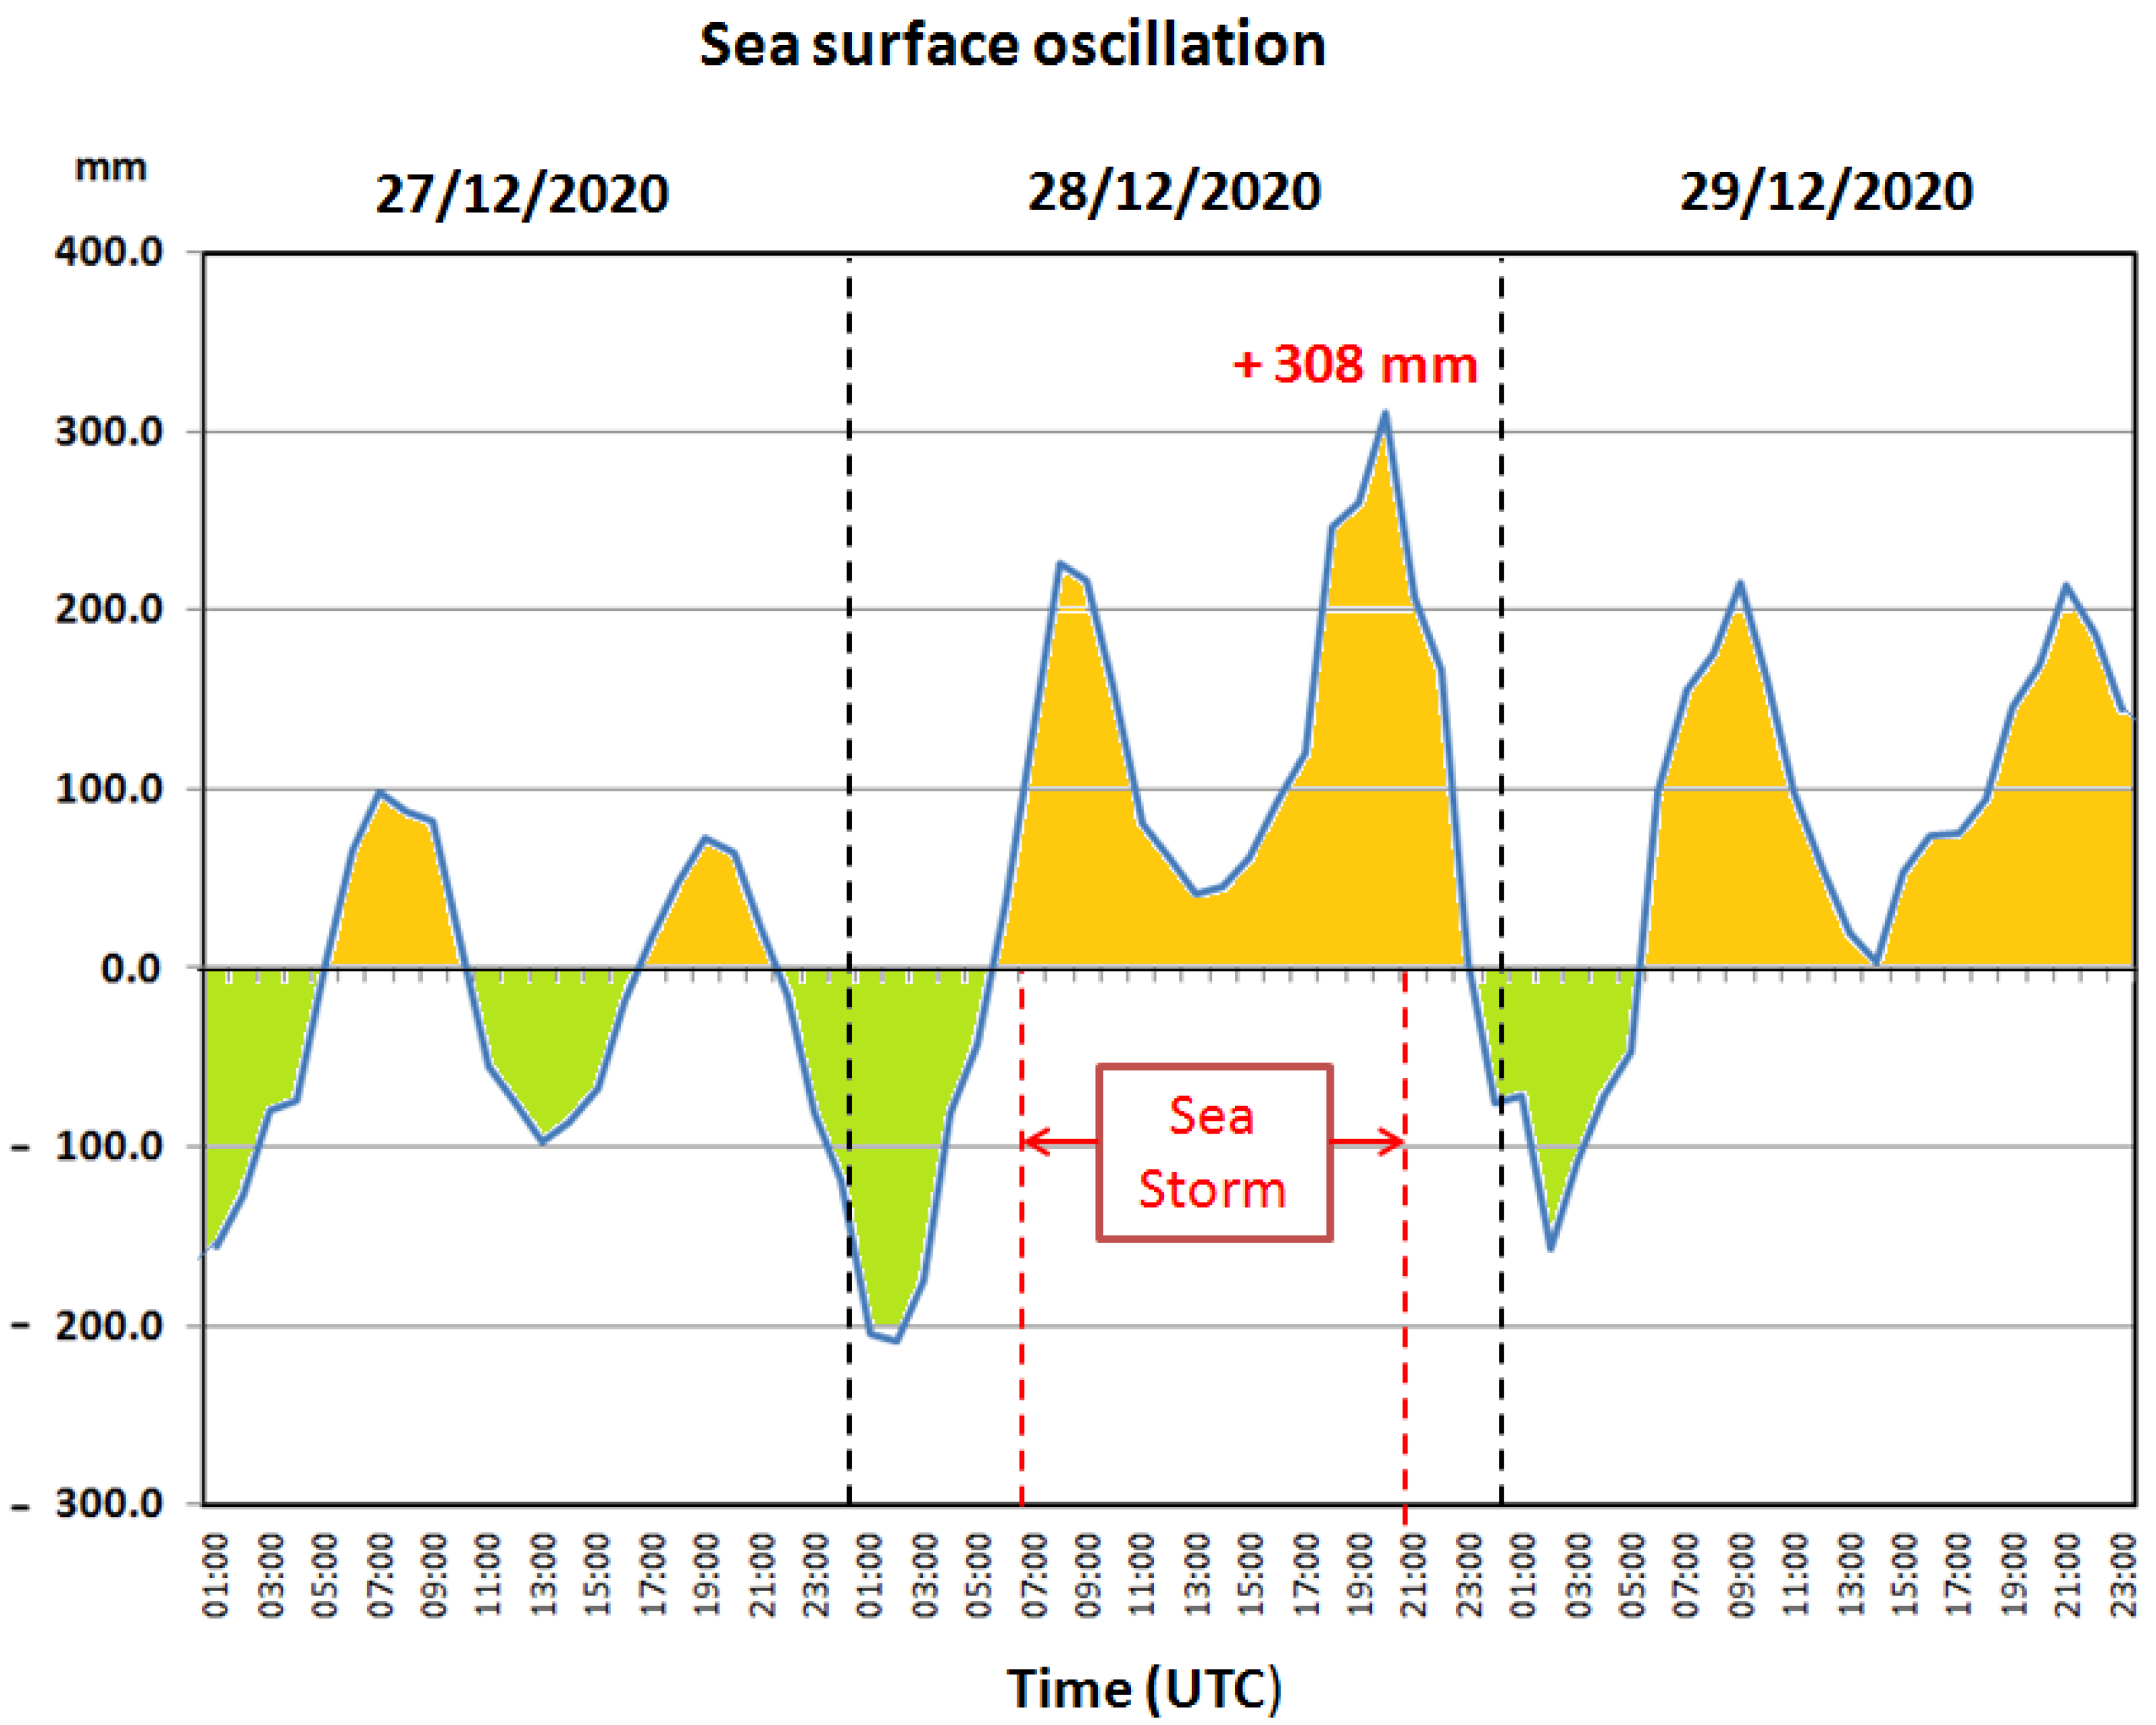
The wind waves are superimposed on the sea surface level, which oscillates because of astronomical and barometric forcing. Therefore, it is necessary to evaluate the altimetric oscillations of the sea surface to establish the level of the crests and correctly relate them with the coastal infrastructures. The sea level data collected by two tide gauges located in the Port of Naples and Gulf of Pozzuoli were used to evaluate the altimetric oscillations of the sea level during and before the sea storm (Figure 16).
The maximum uplift of the sea surface level is equal to 0.308 m, including the astronomical and barometric contribution. The maximum astronomical tidal amplitude occurs in the sigitial phase, with the following values for the study area [43]:
  • maximum rise in sea level:               Sm(+) = +0.21 m,
  • maximum lowering of sea level:       Sm(−) = −0.21 m.
The atmospheric pressure contribution SΔp(+), the storm wind surge S and the uplift due to breaking wave motion contributions are considered for the definition of the meteorological tide. The sea surface undergoes a change in level of 0.0101329 m for each hPa of variation in the barometric pressure, in reference to the normal atmospheric pressure equal to 1013.2 hPa. In our case, we have:
SΔp(+) = 0.0101329 m · hPa−1 · (1013−996) hPa = 0.17 m.
For the calculation of wind-induced surge, the following relation [48] to be solved by successive attempts was adopted:
S = K p   L p   U 2 g   ( D d S )   ln D d + S   ,
where:
-
Kp = 3 × 10⁻⁶,
-
G = 9.8065 m s−2,
-
d = depth of the seabed at the point where the surge is calculated, assumed to be 0 m,
-
D = limit depth assumed for the continental shelf, assumed to be −200 m,
-
U = constant storm wind speed (set equal to 14.4 m s−1 for the event under consideration), and
-
Lp = extension of the continental shelf (distance between d and D) equal to 15,000 m.
The relation has converged by successive attempts to the solution of S ≈ 0.03 m. In the absence of wind shear effects, offshore waves break in sections characterized by a well-defined depth, thus inducing a rise of sea surface level. Along the coastal zone confined between the breakers line and the shoreline, the sea level undergoes a lowering in the wave breaking area (wave set-down) and a subsequent raising towards the shore (wave set-up). The calculation of the two terms (set-down and set-up) can be performed through the following formula:
Sup = ΔS − Sdw,
with:
ΔS = 0.15 hb,
Sdw = (0.536 · Hb(3/2))/(g(1/2) ·T),
where:
-
Hb = Hc,tot = reference wave height at breaking = 4.5 m,
-
T = period related to reference wave at breaking = 7.8 s,
-
hb = depth of sea bottom at breaking = 1.3 Hb = 5.85 m,
-
ΔS = 0.15 hb = 0.88 m,
-
Sdw = 0.536 Hb(3/2) /g1/2 T = 0.21 m, and
-
Sup = 0.88–0.21 = 0.67 m.
To evaluate the maximum sea level along the analyzed shoreline we sum up all the different contributions, considering the concomitance of all the factors:
Stot = Sm(+) + SΔp(+) + S +Sup = = 0.21 + 0.17 + 0.03 + 0.67 = 1.08 m.
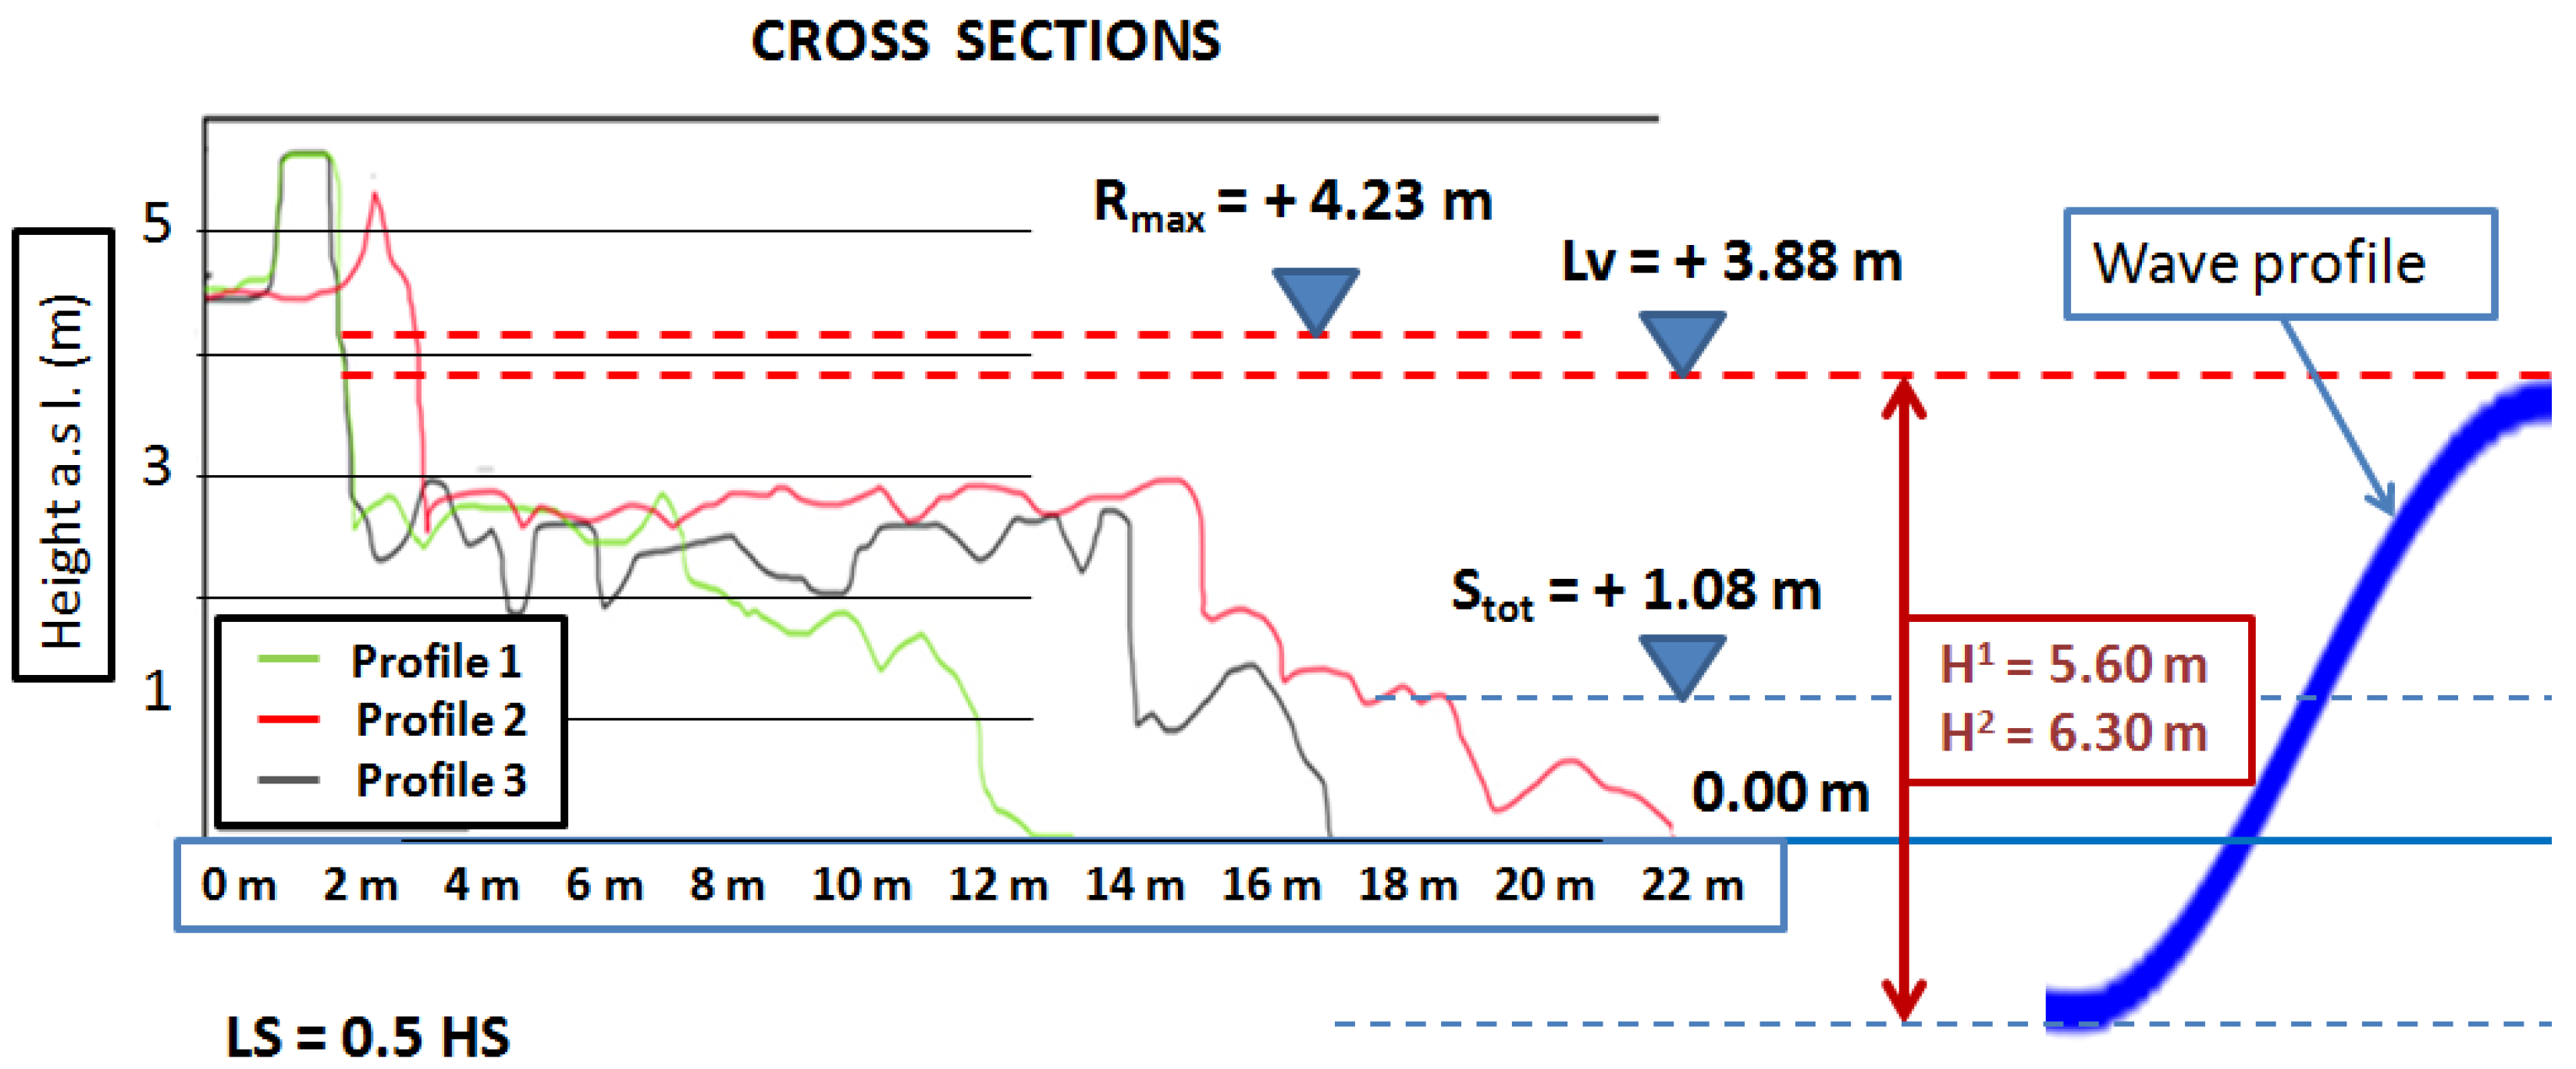
Considering the waves of maximum height (H1= 5.60 m)), Sup is slightly higher or equal to 0.80, so:
Stot = 0.21 + 0.17 + 0.03 + 0.80 = 1.21 m.
Given the uncertainty in the sea dynamics when extreme waves occur, we lean towards the most prudential value, considering Stot =1.08 m.
The average level (H = 0.34 m), corresponding to the astronomical and barometric components, is similar to the calculated component, equal to 0.38 m. The maximum uplift of wave crests (Lv) with respect to the mean sea level may be calculated as follows:
Lv = H1/2 + Stot = 2.80 + 1.08 = 3.88 m.

6. Sea Storm Effect Analysis

6.1. Local Scale Interactions between Wave Motion and Coastal Features

The stretch of Via Partenope near Castel dell’Ovo has suffered from the heaviest effects during sea storms coming from S to SW directions. The vulnerability of this stretch of coast depends on a number of local factors (Figure 3). Particularly, the presence of Castel dell’Ovo bastion, given the relatively high-water depth to the SW of the structure, causes a “wall effect” and a significant reflection of the incoming waves towards the coastline. In Figure 17, a set of four pictures has been collected, showing wave fronts propagating from SSW to NNE during the phase of maximum intensity of the swell and the interaction with the seawall protecting Via Partenope. The complex scenario of wave motion in front of Via Partenope, due to the reflection of incident waves on the western bastion of Castel dell’Ovo is shown in Figure 18.
The western bastion of the Castel dell’Ovo reflects the incident waves (wave fronts 1-2-3), creating reflected wave trains (wave fronts 1’-2’-3’) that propagate along ESE-WNW direction. Reflected waves have a limited extension, as the interaction of waves with the Castel dell’Ovo western bastion is relatively limited in time (yellow line in Figure 18a). The reflected waves interact with the incident waves causing a superposition of effects. This leads to marked undulations of the sea surface (Figure 17) due to the composition of the two different wave motions (incident and reflected). Figure 18a indicates the points where the incoming and reflected waves combine. The dynamics of waves interaction leads to a chaotic scenario where the incoming waves prevail, and rogue waves may also form.
Photos and video images from the evening of 28 December 2020, show that the wave crests in front of Via Partenope were diffusely breaking (see Figure 17) due to the progressive shallowing of the seafloor. The merging of the incident waves with reflected waves results in an overall deviation to the NW from the direction of the incoming waves.
The combined analysis of available photographic and video images in the phase of maximum wave development allowed for the estimation of the wavelength L as distance between the major wave crests and, therefore, the evaluation of the period T characterizing the main wave motion. This analysis led to establish a value of about 100 m for the wavelength. To obtain the period, we use the following relation existing between L and T:
L = 1.5 T 2 = > T = ( L 1.5 ) = 8.2   s .
This value is significantly higher than the maximum observed at the wave buoy of the Parthenope University, equal to 6.6 s (Table 5), which corresponds to a wave motion with a wavelength equal to 65 m. This value is also higher with respect to the one extracted by Gröen-Dorrestein nomogram for Hc (7.3 s) and almost equal to the one relative to Hmax, thus confirming the assumption that wave enhancing factors are present, at local scale, in the area.

6.2. Reflective Effect of Castel Dell’Ovo on Wave Motion

The presence of Castel dell’Ovo represents an enhancing factor on overall wave motion in front of Via Partenope. The interaction between waves and Castel dell’Ovo bastion is comparable to a surging process (Figure 19), occurring on very steep seabed and leading to reflective processes.
To estimate the influence of reflected energy, we consider the dynamics occurring in the local coastal setting. For the evaluation of the energy carried by a surface wave, we apply the simplified study for a sine wave (Figure 20) and Equation (16).
ξ   ( x ) = a sin   ( 2 Π λ · x ) .
The potential energy V of the infinitesimal mass of fluid dm = ρ dxdz increases moving from −z to +z:
dV = dm·g·(z − (−z)) = 2ρgz dxdz.
The total variation in potential energy of the fluid is equal to:
V = x = 0 x = λ / 2 z = 0 z = a   sin 2 π x / λ z   dz   dx = 1 4 ρ   g   λ   a 2 .
Assuming the principle of energy equipartition (the change in average kinetic energy is equal to the change in average potential energy), we may conclude that the total energy of a surface wave per unit of wavefront width and per unit of wavelength λ is equal to:
J λ = 2 V λ = 1 2   ρ ga 2 ,
where Jλ is an energy flux and is measured in Jm-2.
The reflection processes on the western bastion of the Castel dell’Ovo involve an energy transfer from Supplementary S2 (L2 = 180 m wide) to Supplementary S1 (L1 = 300 m wide) (Figure 18b).
The reflection processes are not perfect:
Etot = E1 + kE2,
where 0 < k < 1.
We calculate the energy flux relative to Supplementary S1 ed Supplementary S2, and then, under the hypothesis that the amount of reflected energy is equal to 50% of total energy impacting on Castel dell’Ovo, we evaluate the influence in terms of surplus of energy and greater wave height. The calculation indicates a surplus of about 25% in energy flux. Waves also show an increase in height of about 10–15%. It is possible to evaluate the maximum absolute wave height, add to the lifted sea level, and estimate the relation between coastal infrastructures and wave motion:
H2 = H1/2 + 0.125 H1/2 = 2.80 + 0.125 · 2.80 = 3.15 m,
Rmax,abs = 3.15 + 1.08 = 4.23 m.
Based on the analysis of the storm wave interaction with Via Partenope wall vestment, this wave crest height (Rmax,abs = +4.23 m a.s.l.) will be considered to characterize the exceptional nature of the sea storm event. The maximum run up (Rmax) triggered by extreme swells (T = 100 years) in front of Via Caracciolo and Via Partenope was evaluated as R100 = 3.95 m a.s.l. by the Autorità di Bacino nord-occidentale della Campania [43]. The comparison between Rmax and R100 indicates that the event occurred on 28 December 2020 is larger than the one statistically generated for a return period of 100 years. A fundamental role was played by Castel dell’Ovo in determining a reflection of the wave energy that has resulted in a surplus wave height of 0.35 m which, in turn, caused the recent event to exceed the one evaluated for T = 100 years. The maximum run up led the wave crests to reach a height only 0.60 m below the upper border of the seawall.

6.3. UAS Survey Results

The adopted remote sensing techniques, such as photogrammetry from UAS surveys, has resulted as particularly effective in detecting and measuring coastal features and their modifications in the study area induced by the 28 December 2020 sea storm. The acquired dataset was made up of nadiral imageries collected on the heavily damaged sector of Via Partenope (Figure 21a). By using SfM algorithms in Agisoft Metashape© software [35], we obtained high-resolution orthophoto (1.21 cm/pix) and DEM (2.43 cm/pix) (Figure 21b,c). The analysis of UAS survey results allowed for focusing on geometric damage indicators, such as seawall erosion or presence of debris. The survey performed by drone allowed obtaining the measurements of the damaged sector of Via Partenope by means of the automatic tool of Agisoft Metashape software, that was very useful for a quick estimation of damages extension. The total damaged area was 0.0225 km2.
The detail of the orthophoto (Figure 22) shows the reduction in width of the seawall, as a consequence of the recent swells, and the presence of fallen blocks along the sea bottom near the seawall between profiles 1 and 3. Three ground profiles (Figure 23) were obtained, using the high-resolution DEM derived by UAS surveys to evaluate the actual shape of the coastal protection structure. The obtained topographic profiles of the seawall have been compared with the calculated wave profile (Figure 23). A complete submersion of the seawall due to the relevant height of the waves and to the reduced height of the seawall itself can be inferred by these figures. This condition can be considered as responsible for the undermining of the coastal protection structures and of the redistribution of the blocks at the seawall foot because of the reflux of seawater through individual rock blocks, facilitated by the floatage effect affecting the blocks themselves. This process is self-regenerating and, when activated, accelerates its evolution whenever an intense swell occurs.

7. Discussion

Coastal risk in the Mediterranean area is rising due to growing population, commerce and infrastructure in coastal areas, and the impacts of global sea level rise and warming, associated with increased frequency of sea storms. Major coastal hazards are represented by storm surges and the coastal flooding caused by severe tropical or extra-tropical storms. Storms in the Mediterranean Sea are frequent especially during the winter months and their impact on coastal infrastructures and environment is highly hazardous.
The present study analyzes the extreme sea storm event that occurred on 28 December 2020 in the Gulf of Naples. The exceptional nature of this storm is well represented by the maximum evaluated Run Up, which in the order of magnitude for the events with a return time equal to 100 years [43].
The event observed on 28 December 2020 was mainly characterized by the sea conditions, including the wind induced wave motion. The overall maximum wind speed measured by the meteorological monitoring network, although intense, was not exceptional, as it can be usually observed at least once in a year. The sea roughness, instead, was of extraordinary intensity. Particularly, the wave crests height was remarkable as the storm occurred in phase with the astronomical tidal maximum in sigitial phase. The damage on the coastal infrastructures was consequently very high.
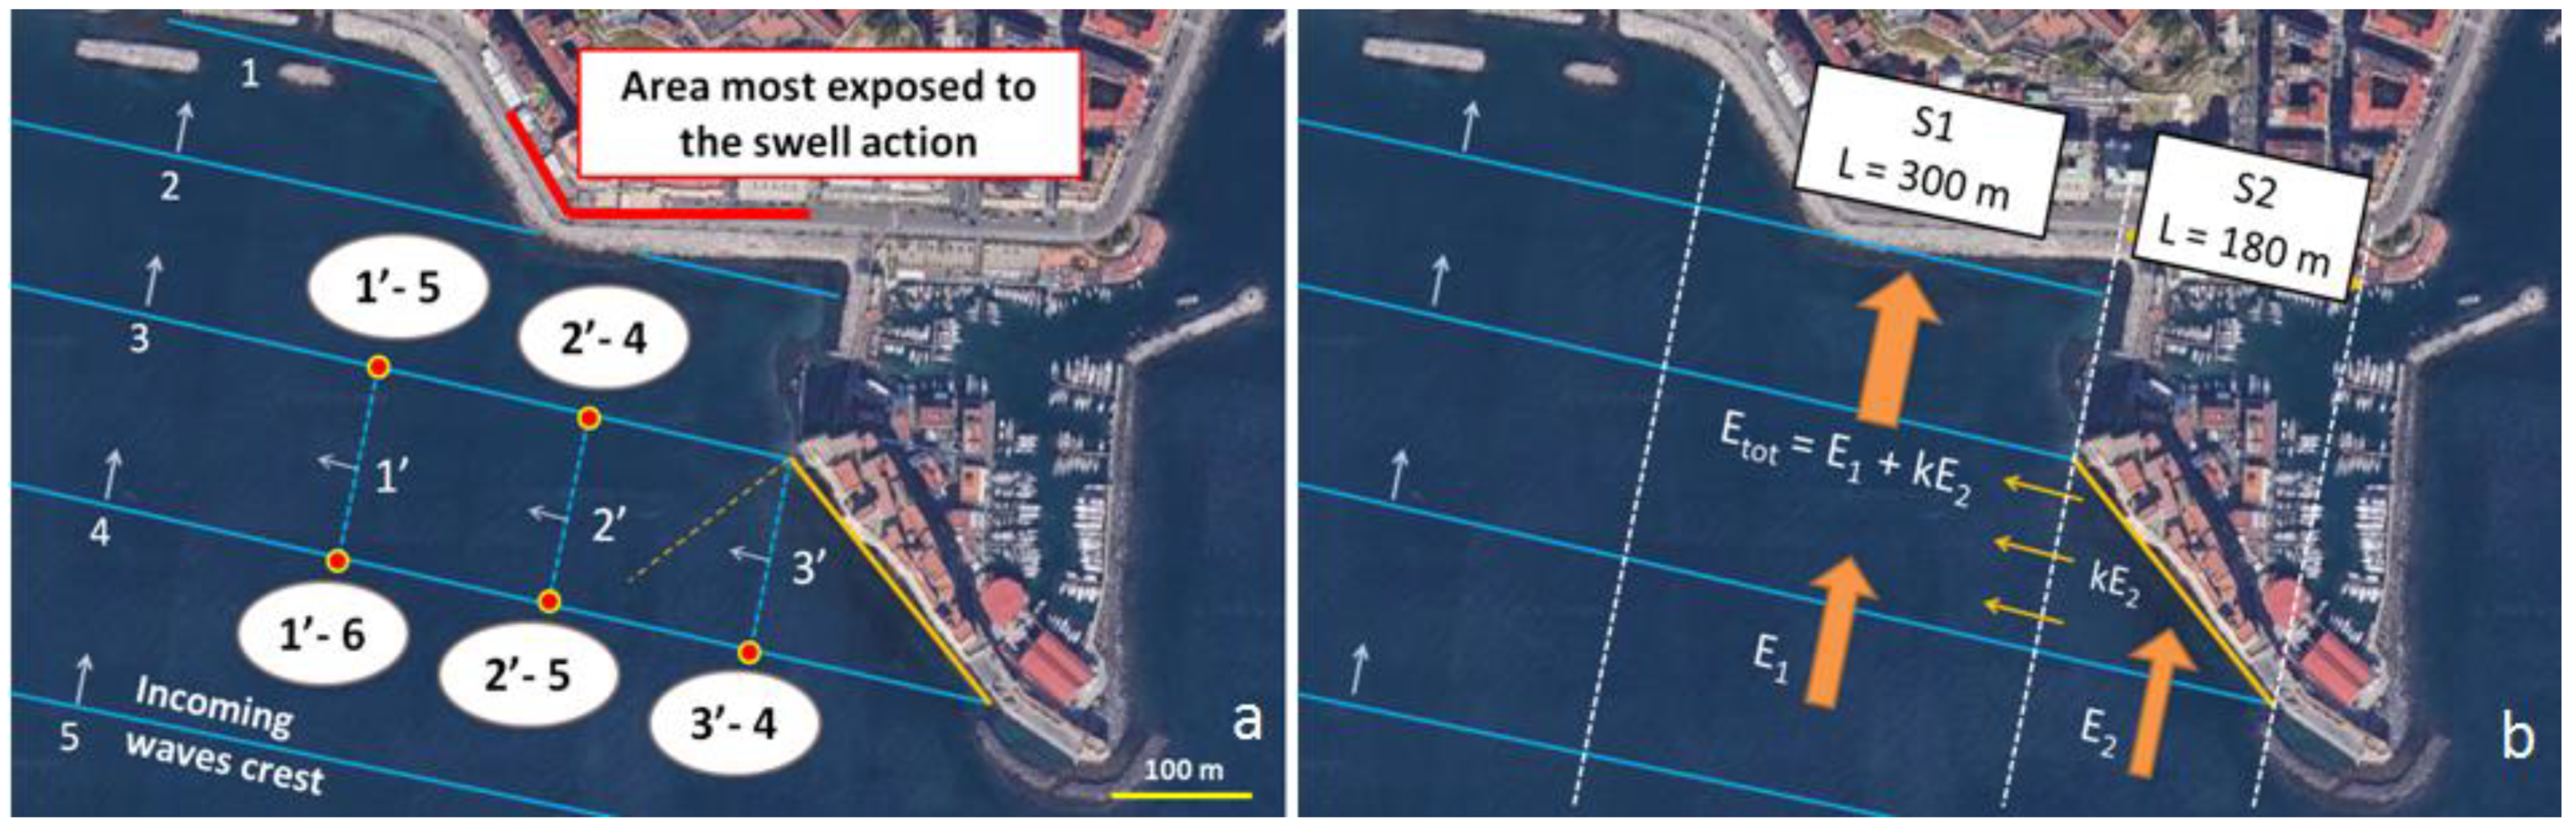
The results of our study suggest that Castel dell’Ovo western bastion played a major role by interfering with the wave motion in front of Via Partenope, thus causing waves 10–15% higher than normal when the incoming direction is between SSW to SW, as recorded on 28 December 2020. This research also highlights the importance of integrating the analysis of the entire spectrum of factors that control the entity of the storm surge phenomenon. The surge calculated as a consequence of all the factors was 1.08 m. This value, under conditions of unlimited fetch and for equal duration of the wind event, corresponds to a wave height generated by a wind of greater intensity. The analysis of the present wind event through Gröen-Dorrestein nomogram, characterized by a duration of 14 h and an average wind speed (15 m s−1), suggests that a greater wave height of 1.08 m, for the same duration, is generated by a higher wind event with an average intensity of 17.5 m s−1 (+20%).
Our results confirm the results of modeling studies on directional storm surge in enclosed seas [49] and wind and wave setup contributions to extreme sea levels at a tropical high island [50]. Usually, surge height depends on the cosine of the angle between the wind direction and the major axis of the narrow gulf. Even though a longer fetch will produce higher storm surge, the exact relationship is complex and dependent on the local physiography, as observed for case studies of the Red Sea and the Adriatic Sea [49]. Numerical simulations of wind waves, storm-surge, and wave setup indicate that the storm track and the local morphology led to local differences in extreme sea levels, in the order of 1 m along Samoa coastline [50].
In our case a relevant contribution was given by tidal rise of local sea level. Other studies have also confirmed the importance of the timing of the sea storm landfall relative to local high tide, as observed in storm surge simulations made for Sandy Hurricane which struck New York area in 2012 [51]. The present study also suggests that, in the case of artificial cost (e.g., when a seawall occupies protects the coastline), wave breaking occurs at the toe of the structure, and wave height needs to be considered independently from the runup [52]. In these cases, flood risk may be underestimated if storm surge height alone is considered, and wave characteristics need to be incorporated in order to adequately model magnitude and extent of the potential flood [52].
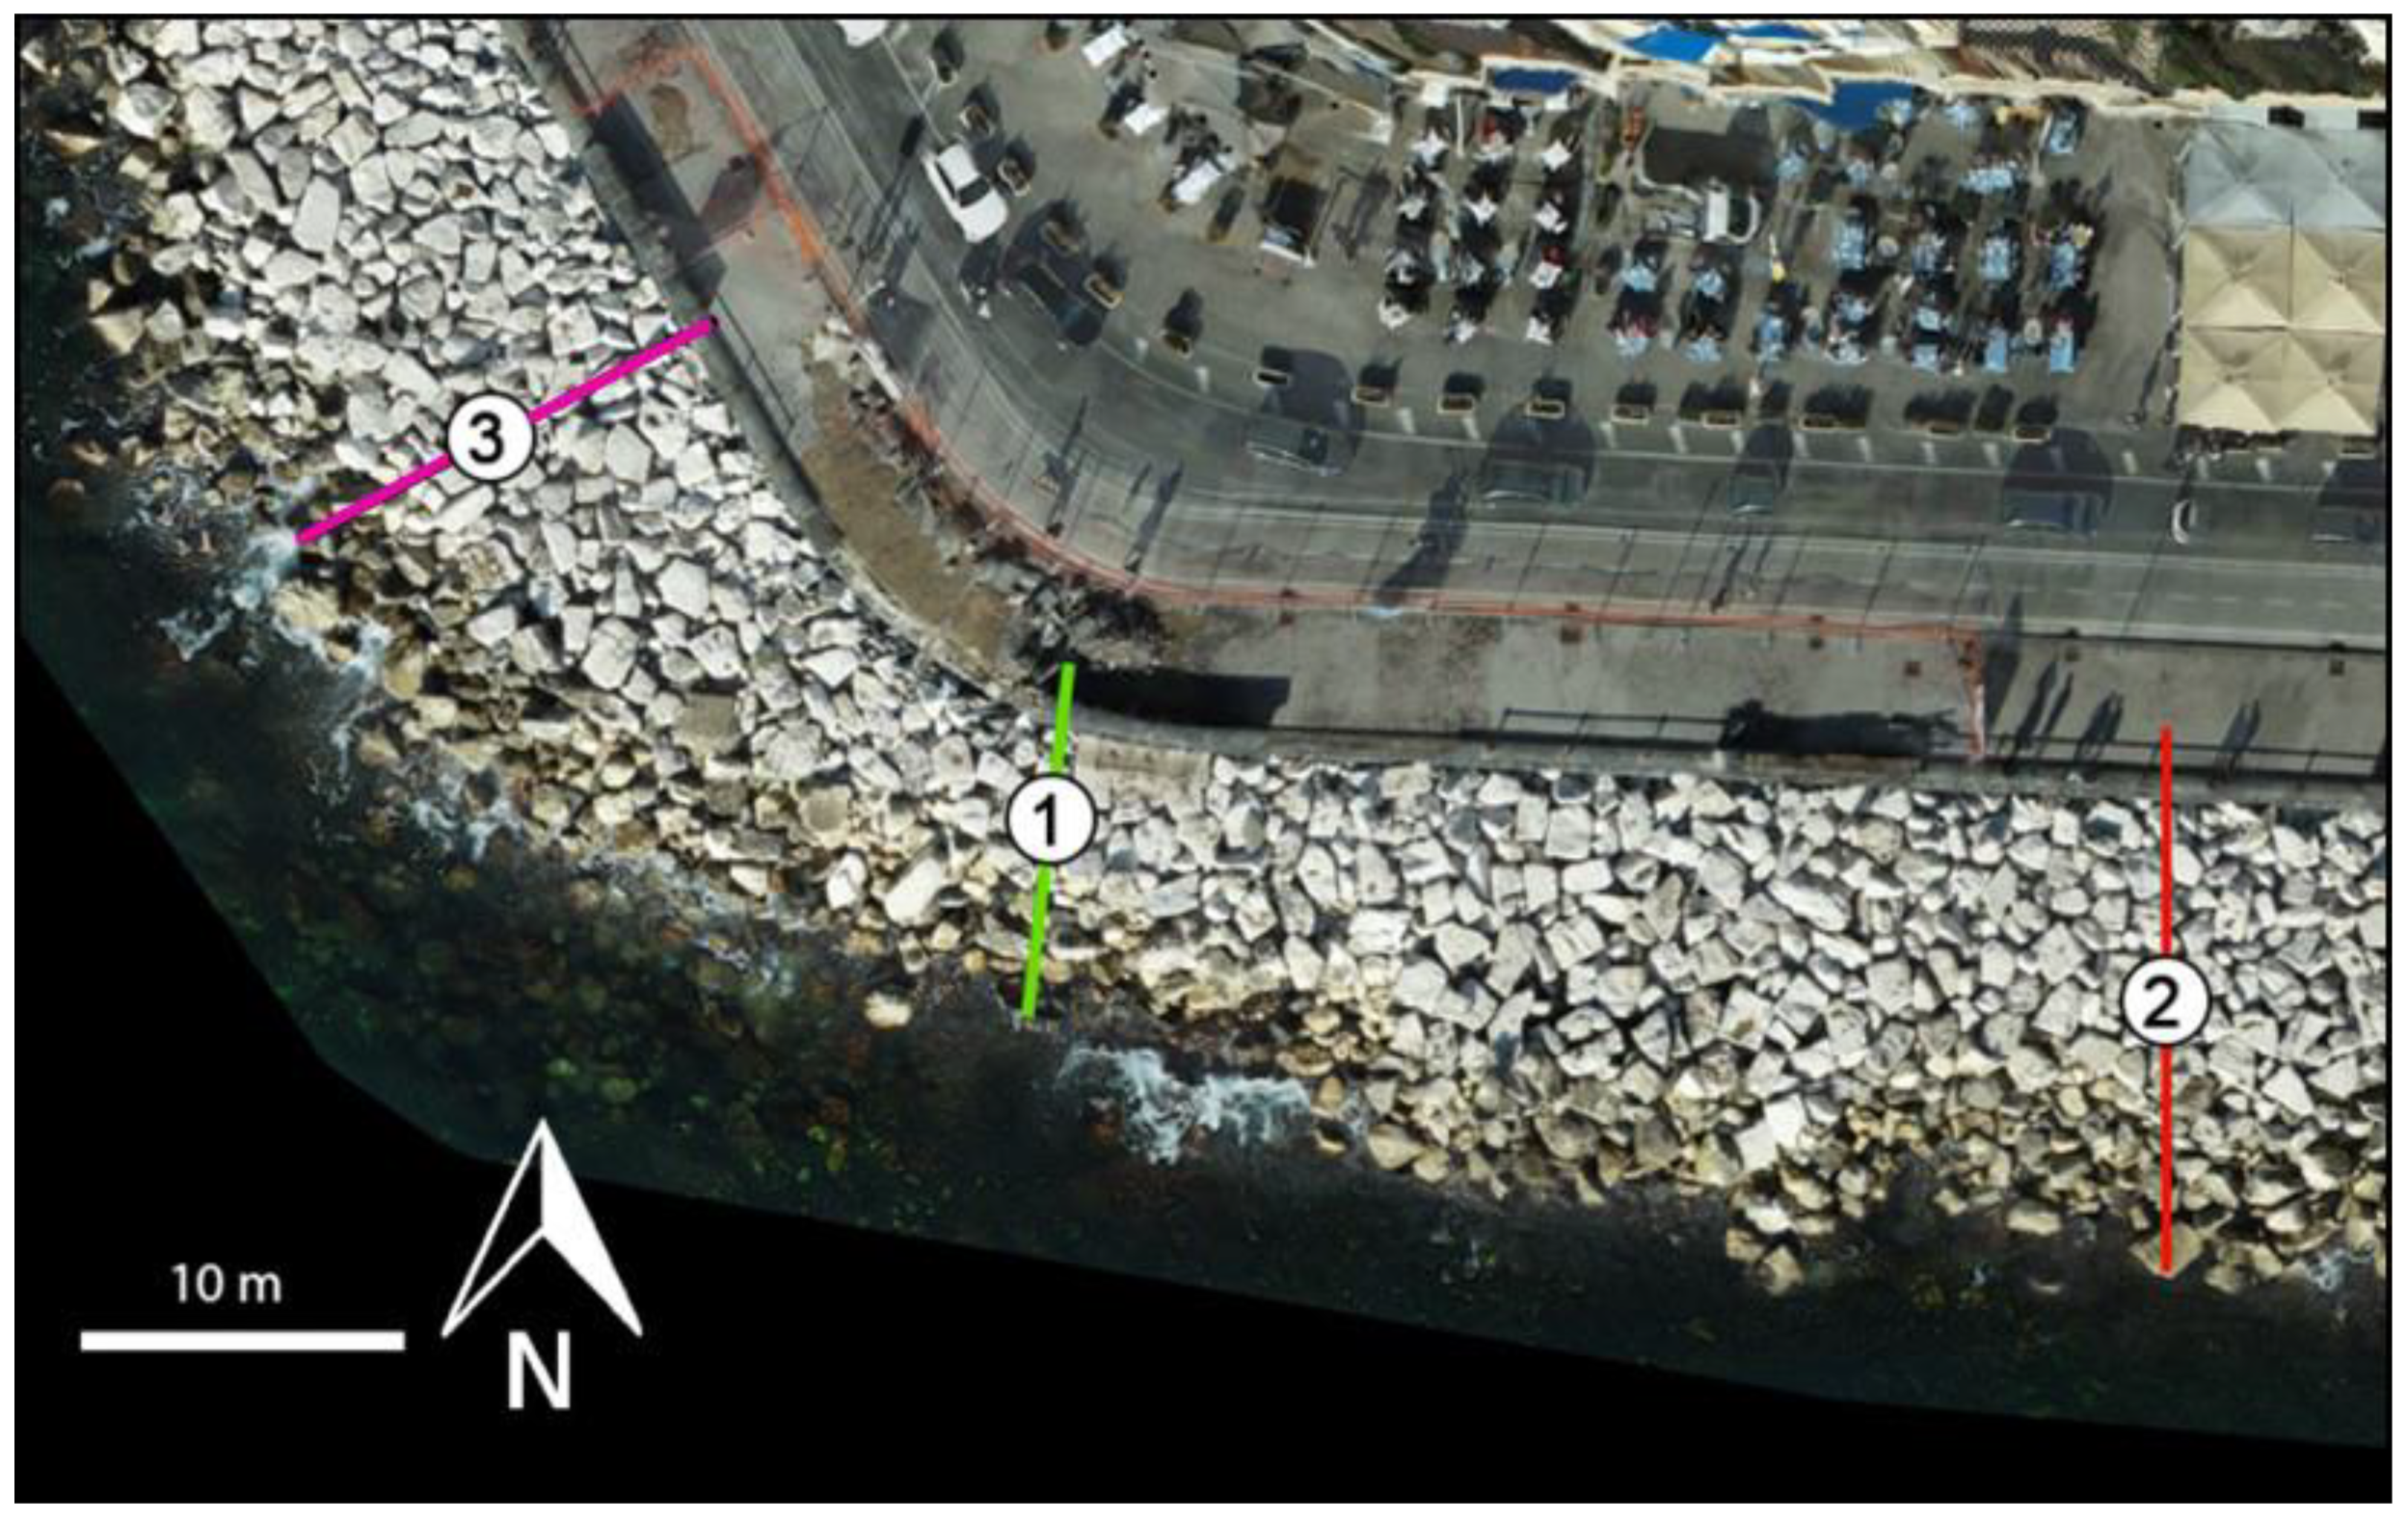
The results of the UAS survey provided detailed information on the coastal impact of the storm and a detailed 3D reconstruction of the seawall sector heavily damaged during the event [53]. The 3D topographic data confirmed the occurrence of erosive processes along the seawall during the sea storm resulting in a generalized instability of the calcareous rock blocks at the base of the seawall.
The detailed topographic profiles (Figure 23) clearly show that the combined effects of seawall reduction and local scale effects on wave heights favored the final flooding of the coastal stretch of Via Partenope and the seawall during the storm event.

8. Conclusions

The risk related to extreme marine events is significantly high along the coastal area of the Gulf of Naples, Italy. On 28 December 2020, the area has been hit by an extreme sea storm, with severe consequences along most areas of Naples’ coastline. In the waterfront area of Via Partenope, Naples, the waves overrun the roadway, causing extensive damage on the coastal seawall, roads, and touristic structures.
In this study, we analyze the meteorological evolution of the sea storm and its effects on the waterfront, suggesting that Castel dell’Ovo western bastion and tuff cliffs have enhanced the local-scale wave magnitude and associate coastal damage, due to induced reflective processes on the waves approaching the coastline. Satellite meteorological data were integrated by accurate estimates of meteorological parameters obtained from weather sensor networks and UAS digital photogrammetry data processed with the SfM technique.
The analysis of the event of 28 December 2020, suggests that our ability in predicting the effects on the coast of a sea storm may be improved by considering all local scale factors, including the duration and intensity of wind events, the tidal component, and wave diffraction and reflection phenomena. For this scope, the application of remote sensing integrated systems, such as UAS surveys and digital photogrammetry, represents an effective support in the assessment of damages, resilience, and vulnerability and the evaluation of adequate risk mitigation measures to be adopted for coastal zone management. The outcomes of the present study also provide a contribute for specialists in construction/design engineering towards the planning of protection structures along the coasts.

Supplementary Materials

The following are available online at https://www.mdpi.com/article/10.3390/app112311460/s1, Two brief explanatory text have been added as supplementary material, namely: “S1. Explanation of the used terminology” and “S2. Gröen and Dorrestein nomogram comment”.

Author Contributions

Conceptualization, A.F. (Alberto Fortelli) and F.M.; Methodology, A.F. (Alberto Fortelli), A.F. (Alessandro Fedele) and F.M.; Software, A.F. (Alessandro Fedele); Validation, A.F. (Alberto Fortelli), F.M. and R.S.; Formal Analysis, A.F. (Alberto Fortelli); Investigation, A.F. (Alberto Fortelli) and A.F. (Alessandro Fedele); Data Curation, A.F. (Alberto Fortelli); Writing—Original Draft Preparation, A.F. (Alberto Fortelli), A.F. (Alessandro Fedele), F.M. and R.S.; Writing—Review & Editing, F.M. and M.S.; Visualization, A.F. (Alberto Fortelli) and A.F. (Alessandro Fedele); Supervision, C.T., G.D.N., F.M. and M.S., Project Administration, A.F (Alberto Fortelli). All authors have read and agreed to the published version of the manuscript.

Funding

This research received funding from PRO-DAM project, PO FEAMP 2014-2020 Reg.(UE) n.508/2014–Misura: 2.51 project, and PON-S4E-SCN-00393 project.

Data Availability Statement

The data presented in this study are available in the article.

Acknowledgments

The Massalubrense ondametric buoy data of were made available thank to the courtesy of Giorgio Budillon–Dipartimento di Scienze e Tecnologie-Parthenope University–Naples, Italy.

Conflicts of Interest

The authors declare no conflict of interest.

References

  1. Pérez-Maqueo, O.; Intralawan, A.; Martínez, M. Coastal disasters from the perspective of ecological economics. Ecol. Econ. 2007, 63, 273–284. [Google Scholar] [CrossRef]
  2. White, A.U. Global summary of human response to natural hazards: Tropical cyclones. In Nat Hazards: Local, National, Global; Oxford University Press: New York, NY, USA, 1974; pp. 255–265. [Google Scholar]
  3. Mucerino, L.; Albarella, M.; Carpia, L.; Besioc, G.; Benedettid, A.; Corradia, N.; Firpoa, M.; Ferrari, M. Coastal exposure assessment on Bonassola bay. Ocean. Coast. Manag. 2019, 167, 20–31. [Google Scholar] [CrossRef]
  4. Littmann, T. An empirical classification of weather types in the Mediterranean basin and their interrelation with rainfall. Theor. Appl. Climatol. 2000, 66, 161–171. [Google Scholar] [CrossRef]
  5. González-Alemán, J.J.; Pascale, S.; Gutierrez-Fernandez, J.; Murakami, H.; Gaertner, M.A.; Vecchi, G.A. Potential increase in hazard from Mediterranean hurricane activity with global warming. Geophys. Res. Lett. 2019, 46, 1754–1764. [Google Scholar] [CrossRef]
  6. Androulidakis, Y.S.; Kombiadou, K.D.; Makris, C.V.; Baltikas, V.N.; Krestenitis, Y.N. Storm surges in the Mediterranean Sea: Variability and trends under future climatic conditions. Dyn. Atmos. Ocean. 2015, 71, 56–82. [Google Scholar] [CrossRef]
  7. Pasi, F.; Orlandi, A.; Onorato, L.F.; Gallino, S. A study of the 1 and 2 January 2010 sea-storm in the Ligurian Sea. Adv. Sci. Res. 2011, 6, 109–115. [Google Scholar] [CrossRef]
  8. Kerkmann, J.; Higgins, M.; Lancaster, S.; Roesli, H.P.; Tsiniari, E.; Sachweh, M. Medicane Qendresa Hits Malta and Sicily. EUMETSAT. 2014. Available online: https://www.eumetsat.int/medicane-qendresa-hits-Malta-and-Sicily (accessed on 6 September 2021).
  9. Nietosvaara, V.; Mahovic, N.S.; Szenyan, I.; Azcarate, A.A. Tropical Storm-Like Cyclone Causing Storms, Severe Wind and High Seas over Ionian Sea. EUMETSAT. 2020. Available online: https://www.eumetsat.int/medicane-over-ionian-sea-causes-storms-italy-and-greece (accessed on 6 September 2021).
  10. Köppen, W. Das geographische system der klimate. In Handbuchder Klimatologie; Köppen, W., Geiger, R., Eds.; Gebrüder Borntraeger: Berlin, Germany, 1936; Volume I, Part C. [Google Scholar]
  11. Belda, M.; Holtanová, E.; Halenka, T.; Kalvová, J. Climate classification revisited: From Köppen to Trewartha. Clim. Res. 2014, 59, 1–13. [Google Scholar] [CrossRef] [Green Version]
  12. Uttieri, M.; Cianelli, D.; Buongiorno Nardelli, B.; Buonocore, B.; Falco, P.; Colella, S.; Zambianchi, E. Multiplatform observation of the surface circulation in the Gulf of Naples (Southern Tyrrhenian Sea). Ocean Dyn. 2011, 61, 779–796. [Google Scholar] [CrossRef]
  13. de Ruggiero, P. A high-resolution ocean circulation model of the Gulf of Naples and adjacent areas. Nuovo Cim. 2013, 36, 143–150. [Google Scholar]
  14. de Ruggiero, P.; Napolitano, E.; Iacono, R.; Pierini, S. A high-resolution modelling study of the circulation along the Campania coastal system, with a special focus on the Gulf of Naples. Cont. Shelf Res. 2016, 122, 85–101. [Google Scholar] [CrossRef]
  15. Menna, M.; Mercatini, A.; Uttieri, M.; Buonocore, B.; Zambianchi, E. Wintertime transport processes in the Gulf of Naples investigated by HF radar measurements of surface currents. Nuovo Cim. 2007, 30, 605–622. [Google Scholar]
  16. Bartzokas, A. Annual variation of pressure over the Mediterranean area. Theor. Appl. Climatol. 1989, 40, 135. [Google Scholar] [CrossRef]
  17. Hatzaki, M.; Flocas, H.A.; Simmonds, I.; Kouroutzoglou, J.; Keay, K.; Rudeva, I. Seasonal aspects of an objective climatology of anticyclones Affecting the Mediterranean. J. Clim. 2014, 27, 9272–9289. [Google Scholar] [CrossRef]
  18. Cianelli, D.; Uttieri, M.; Buonocore, B.; Falco, P.; Zambardino, G.; Zambianchi, E. Dynamics of a very special Mediterranean coastal area: The Gulf of Naples. In Mediterranean Ecosystems; Williams, G.S., Ed.; Nova Science Publishers Inc.: New York, NY, USA, 2012; pp. 129–150. [Google Scholar]
  19. Saviano, S.; Kalampokis, A.; Zambianchi, E.; Uttieri, M. A year-long assessment of wave measurements retrieved from an HF radar network in the Gulf of Naples (Tyrrhenian Sea, Western Mediterranean Sea). J. Oper. Oceanogr. 2019, 12, 1–15. [Google Scholar] [CrossRef]
  20. Mazzarella, V.; Maiello, I.; Ferretti, R.; Capozzi, V.; Picciotti, E.; Alberoni, P.P.; Marzano, F.S.; Budillon, G. Reflectivity and velocity radar data assimilation for two flash flood events in central Italy: A comparison between 3D and 4D variational methods. Q. J. R. Meteorol. Soc. 2020, 146, 348–366. [Google Scholar] [CrossRef]
  21. De Pippo, T.; Donadio, C.; Pennetta, M.; Petrosino, C.; Terlizzi, F.; Valente, A. Coastal hazard assessment and mapping in Northern Campania, Italy. Geomorphology 2008, 97, 451–466. [Google Scholar] [CrossRef]
  22. World Meteorological Organization. World Weather Information Service. Official Forecasts. Available online: https://worldweather.wmo.int/en/home.html (accessed on 6 September 2021).
  23. CNR-ISMAR. Buoy, Platforms and Other Fixed Sites. Available online: http://www.ismar.cnr.it/infrastrutture/sistemi-osservativi/boe-piattaforme-e-altre-reti-fisse (accessed on 6 September 2021).
  24. ISPRA. The National Tidegauge Network. 2021. Available online: https://www.mareografico.it (accessed on 6 September 2021).
  25. INGV. MEDUSA—Multiparametric Elastic-beacon Devices and Underwater Sensors Acquisition System. Available online: https://portale.ov.ingv.it/medusa/ (accessed on 6 September 2021).
  26. Davis Instruments. Vantage Pro2 Weather Station. 2001. Available online: https://www.davisinstruments.com/pages/vantage-pro2 (accessed on 6 September 2021).
  27. Rete Mareografica Nazionale. Available online: https://www.mareografico.it/?session=0S227407388089CR77OD8883&syslng=ita&sysmen=-1&sysind=-1&syssub=-1&sysfnt=0&code=SENS&idse=3 (accessed on 6 September 2021).
  28. Gröen, P.; Dorrestein, R. Zeegolven, Derde, Herziene Druk; Staatsdrukkerij-En Uitgeverijbedrijf: The Hague, The Netherlands, 1976; p. 124. [Google Scholar]
  29. World Meteorological Organization. Guide to Wave Analysis and Forecasting; No. 8; WMO: Geneva, Switzerland, 2018; ISBN 978-92-63-10008-5. [Google Scholar]
  30. Breugem, W.A.; Holthuijsen, L.H. Generalized shallow water wave growth from Lake George. J. Waterw. Port Coast. Ocean. Eng. 2007, 133, 3. [Google Scholar] [CrossRef]
  31. Spetsakis, M.; Aloimonos, J.Y. A multi-frame approach to visual motion perception. Int. J. Comput. Vis. 1991, 6, 245–255. [Google Scholar] [CrossRef]
  32. Lowe, D.G. Object recognition fromlocal scale-invariant features. In Proceedings of the Conference on Computer Vision, Kerkyra, Greece, 20–27 September 1999; Volume 2, pp. 1150–1157. [Google Scholar]
  33. Rabah, M.; Basiouny, M.; Ghanem, E.; Elhadary, A. Using RTK and VRS in direct geo-referencing of the UAV imagery. NRIAG J. Astron. Geophys. 2018, 7, 220–226. [Google Scholar] [CrossRef] [Green Version]
  34. Gonçalves, J.A.; Henriques, R. UAV photogrammetry for topographic monitoring of coastal areas. ISPRS J. Photogramm. 2015, 104, 101–111. [Google Scholar] [CrossRef]
  35. Agisoft. Metashape 1.7. Available online: https://www.agisoft.com/ (accessed on 6 September 2021).
  36. Trifuoggi, M.; Donadio, C.; Mangoni, O.; Ferrara, L.; Bolinesi, F.; Nastro, R.A.; Stanislao, C.; Toscanesi, M.; Di Natale, G.; Arienzo, M. Distribution and enrichment of trace metals in surface marine sediments in the Gulf of Pozzuoli and off the coast of the brownfield metallurgical site of Ilva of Bagnoli (Campania, Italy). Mar. Pollut. Bull. 2017, 124, 502–511. [Google Scholar] [CrossRef]
  37. Buccino, M.; Daliri, M.; Calabrese, M.; Somma, R. A numerical study of arsenic contamination at the Bagnoli bay seabed by a semi-anthropogenic source. Analysis of current regime. Sci. Total. Environ. 2021, 782, 146811. [Google Scholar] [CrossRef] [PubMed]
  38. Buonocore, E.; Donnarumma, L.; Appolloni, L.; Miccio, A.; Russo, G.F.; Franzese, P.P. Marine natural capital and ecosystem services: An environmental accounting model. Ecol. Model. 2020, 424, 109029. [Google Scholar] [CrossRef]
  39. Mattei, G.; Rizzo, A.; Anfuso, G.; Aucelli, P.P.C.; Gracia, F.J. A tool for evaluating the archaeological heritage vulnerability to coastal processes: The case study of Naples Gulf (Southern Italy). Ocean Coast. Manag. 2019, 179, 104876. [Google Scholar] [CrossRef]
  40. Mattei, G.; Aucelli, P.P.C.; Caporizzo, C.; Rizzo, A.; Pappone, G. New Geomorphological and Historical Elements on Morpho-Evolutive Trends and Relative Sea-Level Changes of Naples Coast in the Last 6000 Years. Water 2020, 12, 2651. [Google Scholar] [CrossRef]
  41. Romano, P.; Di Vito, M.A.; Giampaola, D.; Cinque, A.; Bartoli, C.; Boenzi, G.; Detta, F.; Di Marco, M.; Giglio, M.; Iodice, S.; et al. Intersection of exogenous, endogenous and anthropogenic factors in the Holocene landscape: A study of the Naples coastline during the last 6000 years. Quat. Int. 2013, 303, 107–119. [Google Scholar] [CrossRef]
  42. Autorità di Bacino Nord Occidentale della Campania. Carta della pericolosita’ da inondazione ed erosione della costa bassa. Piano per la Difesa delle Coste. Map 2008, 1. 10.000 scale. [Google Scholar]
  43. Autorità di Bacino Nord Occidentale della Campania. Relazione Idraulico-Marittima. In Piano per la Difesa delle Coste; Autorità di Bacino Nord Occidentale della Campania: Naples, Italy, 2009; p. 142. [Google Scholar]
  44. Città di Venezia. Le Acque Alte Eccezionali. Available online: https://www.comune.venezia.it/it/content/le-acque-alte-eccezionali (accessed on 6 September 2021).
  45. CNR-ISAC. Previsioni Meteorologiche CNR-ISAC, GLOBO—BOLAM—MOLOCH Forecasts. Available online: https://www.isac.cnr.it/dinamica/projects/forecasts/bolam/ (accessed on 6 September 2021).
  46. World Meteorological Organization. Guide to Instruments and Methods of Observation Volume I—Measurement of Meteorological Variables; No. 8; WMO IIM: Rome, Italy, 2018; ISBN 978-92-63-10008-5. [Google Scholar]
  47. Istituto Idrografico della Marina. Tyrrhenian Sea from Ischia Island to Punta Licosa. Naut. Map 1974. [Google Scholar]
  48. MATTM-PODIS. Difesa delle Coste e Salvaguardia dei Litorali. In Ministero dell’Ambiente e della Tutela del Territorio. PODIS: Progetto Operativo Difesa Suolo; Istituto Poligrafico e Zecca dello Stato: Roma, Italy, 2005; p. 104. [Google Scholar]
  49. Drews, C. Directional Storm Surge in Enclosed Seas: The Red Sea, the Adriatic, and Venice. J. Mar. Sci. Eng. 2015, 3, 356–367. [Google Scholar] [CrossRef]
  50. Hoeke, R.K.; McInnes, K.L.; O’Grady, J.G. Wind and Wave Setup Contributions to Extreme Sea Levels at a Tropical High Island: A Stochastic Cyclone Simulation Study for Apia, Samoa. J. Mar. Sci. Eng. 2015, 3, 1117–1135. [Google Scholar] [CrossRef] [Green Version]
  51. Colle, B.A.; Bowman, M.J.; Roberts, K.J.; Hamish Bowman, M.; Flagg, C.N.; Kuang, J.; Weng, Y.; Munsell, E.B.; Zhang, F. Exploring Water Level Sensitivity for Metropolitan New York during Sandy (2012) Using Ensemble Storm Surge Simulations. J. Mar. Sci. Eng. 2015, 3, 428–443. [Google Scholar] [CrossRef] [Green Version]
  52. Didier, D.; Bernatchez, P.; Boucher-Brossard, G.; Lambert, A.; Fraser, C.; Barnett, R.L.; Van-Wierts, S. Coastal Flood Assessment Based on Field Debris Measurements and Wave Runup Empirical Model. J. Mar. Sci. Eng. 2015, 3, 560–590. [Google Scholar] [CrossRef]
  53. Ferrando, I.; Brandolini, P.; Federici, B.; Lucarelli, A.; Sguerso, D.; Morelli, D.; Corradi, N. Coastal Modification in Relation to Sea Storm Effects: Application of 3D Remote Sensing Survey in Sanremo Marina (Liguria, NW Italy). Water 2021, 13, 1040. [Google Scholar] [CrossRef]
Figure 1. Location of the study area. Large scale—Italy (a), regional scale—Campania (b), local scales—Gulf of Naples (c), and Naples seafront (d) maps. Names of major localities cited in the text are also reported.
Applsci 11 11460 g001
Figure 2. Location of the weather stations used in this study. Monitoring sites are managed by various research institutions: ISMAR (Consiglio Nazionale delle Ricerche, Istituto di Scienze Marine, Sede di Napoli), ISPRA (Istituto Superiore per la Protezione e la Ricerca Ambientale), INGV (Istituto Nazionale di Geofisica e Vulcanologia, Sezione di Napoli-Osservatorio Vesuviano), and UniParthenope (Parthenope University of Naples).
Applsci 11 11460 g002
Figure 3. Via Caracciolo-Via Partenope waterfront (a) between Mergellina (West) and Castel dell’Ovo (East) (map modified by Reference [41], with images of the effects of historical sea storms); (b) destruction of road pavement in Via Partenope on 4 November 1966; (c) hydrofoil sunk at Mergellina maritime station on 23 December 1979; (d) large waves invade the roadway of Via Partenope on 11 January 1987, when a “tide up” phenomenon occurred along the coast, due to the occurrence of extremely low-pressure values (lower than 990 hPa) and strong breaking waves process in the previous hours. Photos are courtesy of “Il Mattino” newspaper, Naples.
Applsci 11 11460 g003
Figure 4. Sea level pressure maps from 4 November 1966 (a), 23 December 1979 (b), and 11 January 1987 (c). In all cases, a deep Mediterranean low, centered around Sardinia, is active with relevant horizontal barometric gradients on Italy and surrounding seas, triggering strong southerly winds (ERA-20C–1.000° (European Atmospheric Reanalysis of the 20 century). Maps downloaded by www.wetterzentrale.de, accessed on 6 September 2021.
Applsci 11 11460 g004
Figure 5. Meteorological maps (CFS reanalysis 0.500° by wetterzentrale.de) (ac) and satellite images (EUMETSAT 2020) (df) reconstructing the three-day evolution ((a,e), 26 December; (b,d), 27 December; (c,f), 28 December) of the storm during its transition from Iceland to the Mediterranean Sea. Maps downloaded by www.wetterzentrale.de, accessed on 6 September 2021.
Applsci 11 11460 g005
Figure 6. (a) Sea Level Pressure forecasting map valid for 28 December 2020 H18:00 UTC (BOLAM Model [45]); (b) map highlighting the high horizontal gradients over Campania region.
Applsci 11 11460 g006
Figure 7. (a) Satellite image (EUMETSAT 2020) and (b) sea level barometric map (CFS Reanalysis) relative to 28 December 2020-H18:00 UTC. The intense cyclonic system over France is characterized by a complex system of occluded fronts (magenta lines). Blue lines are cold fronts, and red lines are warm fronts.
Applsci 11 11460 g007
Figure 8. Lago Patria, Capo Posillipo, and Port of Naples ISMAR weather stations wind diagrams in reference to the time interval: 28 December 2020-H00.00 to H24:00UTC.
Applsci 11 11460 g008
Figure 9. Main wave exposure angle relative to point P1 in front of Via Partenope.
Applsci 11 11460 g009
Figure 10. Position of the point P0 (coastal waterfront point) and P1 (offshore point, with seafloor at −34 m), significant in analysis of wave motion. Base map by Reference [47].
Applsci 11 11460 g010
Figure 11. Map and diagram of fetch relative to P1 in Figure 10. Map highlights the reduction of fetch in the main wave exposure through the green circle.
Applsci 11 11460 g011
Figure 12. Meteorological map (GFS Operational 0.250°) valid on 28 December 2020-H05:00 UTC for 10 m wind (kt). There is chromatic evidence of winds with gale force. For explanation of 1 and 2 corridors see the main text. Downloaded by www.wetterzentrale.de, accessed on 6 September 2021.
Applsci 11 11460 g012
Figure 13. Hourly average anemometric values (Capo Posillipo and ISPRA-Port of Naples weather stations), with linear interpolation line (red values on the right). Wind direction changes are less than 30°; hence, for simplicity, wave heights and periods are computed along a single (mean) direction.
Applsci 11 11460 g013
Figure 14. Wave growth nomogram modified by Gröen and Dorrestein [28]. The red line illustrates the development of wave motion considering a constant anemometric event (14.4 m s−1) lasting for 14 h.
Applsci 11 11460 g014
Figure 15. Significant wave height of the study event (red point) evaluated with the nomogram modified by Breugem-Holthuijsen [30].
Applsci 11 11460 g015
Figure 16. Sea surface oscillation in the Gulf of Naples on 27–29 December 2020 (Time: UTC). The diagram shows the stormy phase.
Applsci 11 11460 g016
Figure 17. Photos taken from the buildings along Via Partenope, showing the waves scenario during the phase of maximum intensity of the swell.
Applsci 11 11460 g017
Figure 18. Complex scenario of wave motion in front of Via Partenope, due to the reflection of incident waves on the western bastion of Castel dell’Ovo. Reflected waves are indicated with dotted light blu lines 1′-2′-3′ (a). (b) The energy flux reflected by Castel dell’Ovo, enhances the wave energy impacting Via Partenope. Equation indications are from Equation (20).
Applsci 11 11460 g018
Figure 19. Hydrodynamic motion occurring on the western side of the Castel dell’Ovo. Water masses climb up the western bastion of Castel dell’Ovo and then are reflected back towards the seaside. This means that almost no energy dissipation occurs.
Applsci 11 11460 g019
Figure 20. Energy content of a surface sine wave [48].
Applsci 11 11460 g020
Figure 21. UAS survey and raster maps produced from low-altitude aerial images using Structure from Motion (SfM). The location of the obtained high-resolution DEM and orthophoto corresponds to the red line in Figure 18a. (a) Camera locations and image overlap. The black point indicates the grid plan. The different colors show the number of acquired photos; (b) digital elevation model (DEM); (c) orthophoto.
Applsci 11 11460 g021aApplsci 11 11460 g021b
Figure 22. Reduction in width of the seawall, with a maximum in correspondence of the bend of Via Partenope Street (Section 1). The three section profiles are shown in Figure 23.
Applsci 11 11460 g022
Figure 23. Profile sections in correspondence of the damaged area of Via Partenope: the orthophoto shows the very reduced width of the cliff in Section 1, about half with respect to Section 2. The graphical section (Length Scale LS equal to 0.5 Height Scale HS) gives evidence of the complete overtopping of the cliff during the phase of maximum wave heights. Profile traces are in Figure 22.
Applsci 11 11460 g023
Table 1. List of the CNR-ISMAR weather stations (WS).
StationNameCoordinates
WS-01 Lago Patria40°56′37.8600′′ N–14°01′46.5960′′ E
WS-02Bacoli–Lago Miseno40°47′31.6320′′ N–14°04′39.4680′′ E
WS-03Capo Posillipo40°48′05.2200′′ N–14°11′09.6000′′ E
WS-04Port of Naples40°50′39.0480′′ N–14°15′35.5320′′ E
Table 2. List of measured meteorological parameters in the CNR-ISMAR weather stations.
Parameter NameUnitSensor TypeDescription of Measured Parameter
Air temperature°Cthermometerair temperature
Relative humidity%hygrometerrelative humidity
Wind speedm s−1anemometerwind speed (average on last 10 min)
Gust speedm s−1anemometermax gust speed during last 10 min
Wind direction°anemometerprevalent direction of wind during last 10 min
Gust direction°anemometerdirection of maximum gust during last 10 min
Barometric pressurehPabarometersite atmospheric pressure (average on 10 min) adjusted to sea level
Rainfall amountmmpluviometerrainfall amount (cumulated on 10 min)
Rainfall ratemm h−1pluviometermax instantaneous rainfall rate during last 10 min
Table 3. Technical specifications of the sensors of the CNR-ISMAR meteorological station-model DAVIS Vantage Pro2.
SensorParameterData Resolution and UnitRangeAccuracySampling Rate
anemometerwind speed0.5 m s−1 (0.97 knots)0–89 m s−1±1 m s−1 or 5%3 s
anemometerwind direction0–360°±3°3 s
barometerbarometric pressure0.1 hPa540–1100 hPa±1 hPa1 min
hygrometerrelative humidity1%1–100%±2%1 min
rain gaugerainfall amount0.25 mm0–999.8 mm±4%20–24 s
rain gaugerainfall rate0.1 mm h−10–2438 mm h−1±5%20–24 s
thermometerair temperature0.1 °C−40 to 65 °C±0.3 °C10–12 s
Table 4. Geographical (Fg) and reduced (Fr) fetch.
Dir (°)Fg (Km)Fr (Km)
190327327
200317317
210644460
220566460
230672460
Table 5. Observed waves data of SWB-07 Massalubrense Buoy (courtesy of Parthenope University). Maximum values in bold text. Data are in reference to 28 December 2020.
UTCHs (m)Hmax (m)Ts (s)Wave (dir)
06:001.301.704.1264
07:001.502.104.5231
08:001.602.304.5214
09:001.803.204.8210
10:002.103.405.3193
11:002.303.805.7220
12:002.403.605.9229
13:002.503.906.4230
14:002.904.606.6225
15:002.904.406.2217
16:002.904.506.3247
17:003.405.006.6227
18:003.405.006.5220
19:003.405.006.4205
20:003.305.406.4223
Table 6. Wind event as sequence of hourly average wind speed at Capo Posillipo (ISMAR) and Port of Naples (ISPRA) weather stations. Data are in reference to 28 December 2020.
Capo Posillipo
ISMAR
Port of Naples
ISPRA
Average Value
UTCTime ProgrAvg. Ws 1
(m s−1)
Avg. Ws 2
(m s−1)
Avg. Ws 1–2
(m s−1)
Wind Dir
06:0014.99.47.2S
07:0028.311.39.8SSW
08:0036.011.99.0S
09:0046.613.410.0S
10:0059.016.612.8SSW
11:00610.217.013.6S
12:00710.117.313.7S
13:00810.717.814.3SSE
14:00911.516.914.2SSE
15:001011.016.413.7SSW
16:001110.116.913.5S
17:001211.017.514.3SSW
18:001311.518.515.0SSW
19:001411.620.115.9SSW
20:00158.84.68.5SW
Publisher’s Note: MDPI stays neutral with regard to jurisdictional claims in published maps and institutional affiliations.

